Digging Deeper into CME’s July Volumes Shows Energy and Commodity Deviation
Thursday,20/08/2015|14:31GMTby
Barry Ng
After a year of Commodity and Energy volume correlation, data from the CME Group reveals activity has begun to invert.
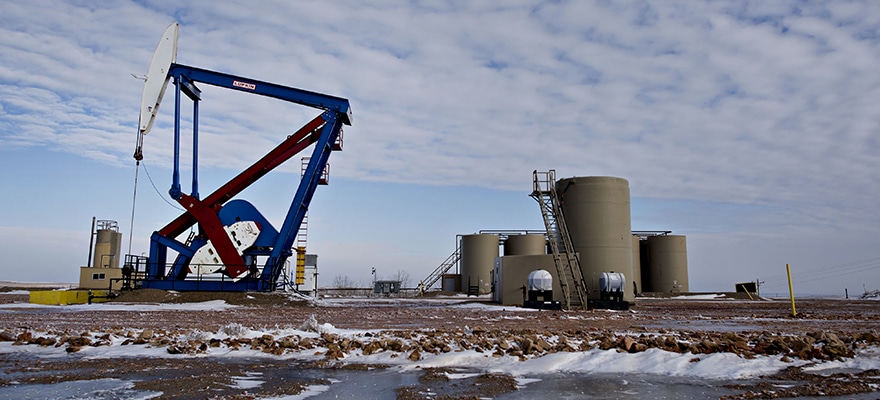
Photo: Bloomberg
Looking into CME volumes for the past year, interesting trends can be noticed. This year has been a volatile one for energy, particularly crude oil. Oil prices have fluctuated from over $100 per barrel to below $40.
A variety of global economic events have fueled these changes, but quite simply, the growth of oil supply has drastically increased, with demand in a slump due to lagging economies in the developed world and increasingly energy efficient technologies. Oil producing countries refuse to cut down production for fear of losing market share, and OPEC refuses to take steps to stabilize prices. With an uncompromising OPEC, a Russia at conflict with Ukraine, and a new nuclear agreement reached with Iran, the future of oil and oil producing countries is anybody’s guess.
As can be expected, spikes in oil prices led to greater volumes of energy contract trading. However, the volume increases weren’t limited to oil and energy, as similar changes in activity were also spotted in the CME Group’s overall group of Commodity Contracts.
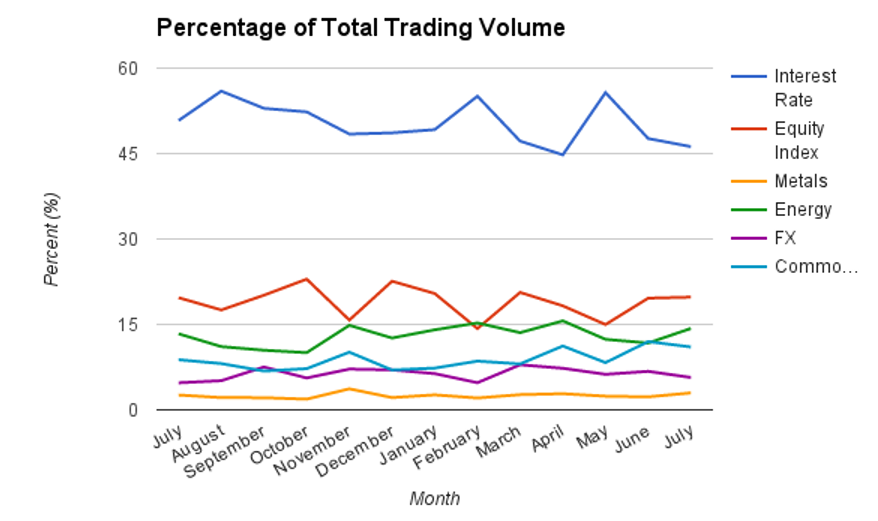
Looking at the trading volumes of asset classes as a percentage of the total volume from CME, the proportionate volume of energy was positively correlated to the proportionate value of commodities in the CME’s report over much of the last year. However, by June of 2015, as seen on this line graph, this trend inverted.
The strong correlation between energy and oil was also viewed in their Pearson Product Moment Correlation. The calculation is a metric used to measure how closely correlated two sets of values are, with a high value of 1 indicating absolute positive correlation, and a value of -1 indicating absolute inverse correlation, and 0 indicating no correlation. Taking the Pearson Coefficient for the percentages of Energy and Commodities gives a value of 0.716 when excluding June and July, indicating a strong correlation. When June and July’s percentages are also added as inputs, the value is 0.454, indicating a weaker correlation.
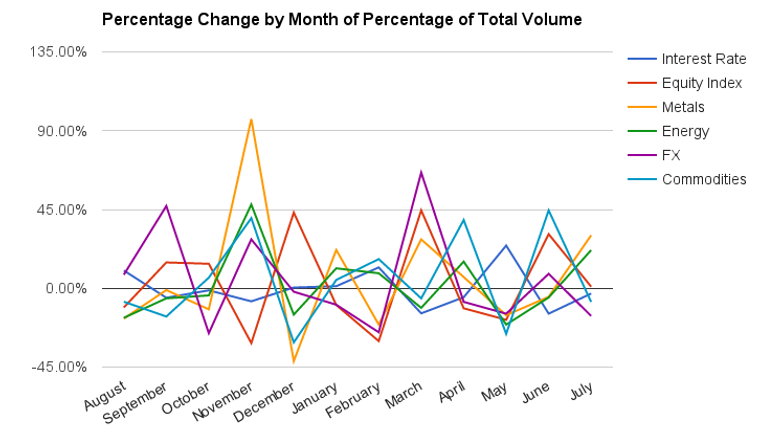
Analyzing a graph of the percentage of change over the months also shows correlation between Energy and Commodities for the past year. The Pearson coefficient of the percentage changes in these two asset classes, excluding June and July, was 0.869, an even higher correlation. Including June and July’s data led to a Pearson value of 0.620. Both Pearson calculations show that there was strong correlation for the entire year between energy and commodities until June of 2015.
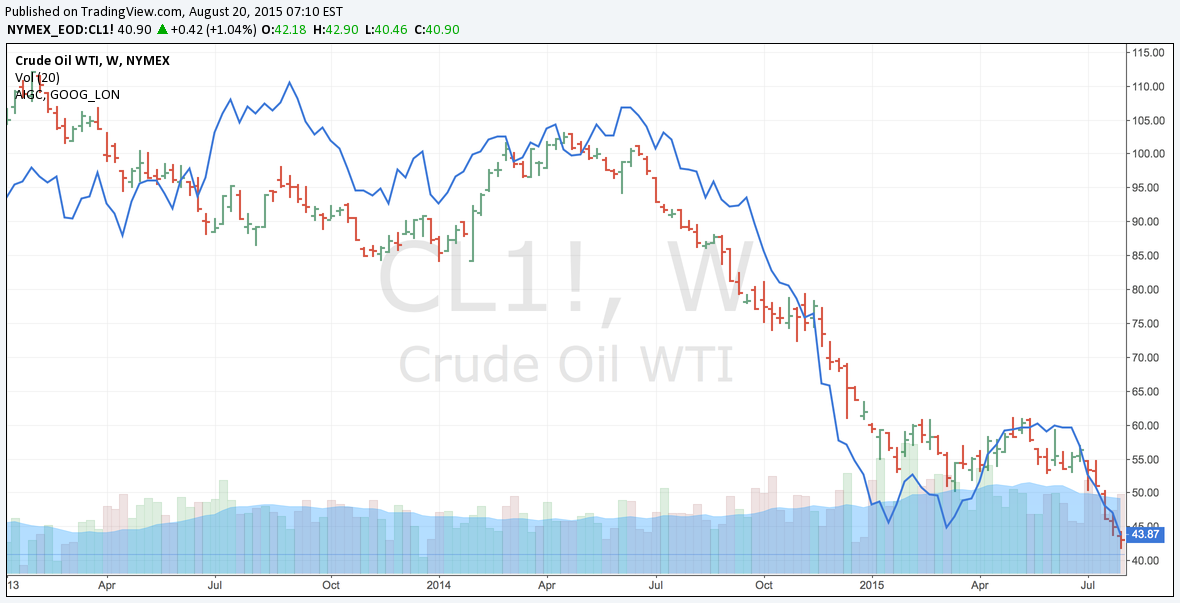
The volumes of Energy and Commodities initially rose in November, the month with the initial and most drastic drop in price of oil. Volume rose again in January and February following speculation on OPEC decisions due to the conflict in Yemen and the arrival of a new King in Saudi Arabia. Volumes rose again in April, a month when oil made a recovery to around $60. Starting in July, oil has steadily dropped back down to below $40, potentially due to the expected increase in oil production with the new agreements in Iran. The correlation of oil to overall Commodities is seen in the chart below of the DJ All Commodity Index vs Crude Oil (blue).
Volume Correlation
As viewed in the chart above, the main factor behind the volume correlation of Energy and Commodity contracts was their connection in price moves. As many commodity traders hold positions in various different products, the correlation between Energy and Commodities volumes may have been attributed to the drop in oil prices, causing investors to either sell off their investments in oil or other commodities to fund losses. With the speculated recovery in February and April, investors were buying back the now cheap oil and commodities.
The sudden diversion of Energy and Commodity volumes in the recent reports of June and July appears to be indicating that despite prices remaining correlated, traders are changing their portfolios habits. The result is that oil is being sold off again, without the need to sell off commodities in tandem. This means many investors expected oil prices to drop again, and adjusted for that risk, ending the yearlong correlation of energy and commodities for now.
Looking into CME volumes for the past year, interesting trends can be noticed. This year has been a volatile one for energy, particularly crude oil. Oil prices have fluctuated from over $100 per barrel to below $40.
A variety of global economic events have fueled these changes, but quite simply, the growth of oil supply has drastically increased, with demand in a slump due to lagging economies in the developed world and increasingly energy efficient technologies. Oil producing countries refuse to cut down production for fear of losing market share, and OPEC refuses to take steps to stabilize prices. With an uncompromising OPEC, a Russia at conflict with Ukraine, and a new nuclear agreement reached with Iran, the future of oil and oil producing countries is anybody’s guess.
As can be expected, spikes in oil prices led to greater volumes of energy contract trading. However, the volume increases weren’t limited to oil and energy, as similar changes in activity were also spotted in the CME Group’s overall group of Commodity Contracts.
Looking at the trading volumes of asset classes as a percentage of the total volume from CME, the proportionate volume of energy was positively correlated to the proportionate value of commodities in the CME’s report over much of the last year. However, by June of 2015, as seen on this line graph, this trend inverted.
The strong correlation between energy and oil was also viewed in their Pearson Product Moment Correlation. The calculation is a metric used to measure how closely correlated two sets of values are, with a high value of 1 indicating absolute positive correlation, and a value of -1 indicating absolute inverse correlation, and 0 indicating no correlation. Taking the Pearson Coefficient for the percentages of Energy and Commodities gives a value of 0.716 when excluding June and July, indicating a strong correlation. When June and July’s percentages are also added as inputs, the value is 0.454, indicating a weaker correlation.
Analyzing a graph of the percentage of change over the months also shows correlation between Energy and Commodities for the past year. The Pearson coefficient of the percentage changes in these two asset classes, excluding June and July, was 0.869, an even higher correlation. Including June and July’s data led to a Pearson value of 0.620. Both Pearson calculations show that there was strong correlation for the entire year between energy and commodities until June of 2015.
The volumes of Energy and Commodities initially rose in November, the month with the initial and most drastic drop in price of oil. Volume rose again in January and February following speculation on OPEC decisions due to the conflict in Yemen and the arrival of a new King in Saudi Arabia. Volumes rose again in April, a month when oil made a recovery to around $60. Starting in July, oil has steadily dropped back down to below $40, potentially due to the expected increase in oil production with the new agreements in Iran. The correlation of oil to overall Commodities is seen in the chart below of the DJ All Commodity Index vs Crude Oil (blue).
Volume Correlation
As viewed in the chart above, the main factor behind the volume correlation of Energy and Commodity contracts was their connection in price moves. As many commodity traders hold positions in various different products, the correlation between Energy and Commodities volumes may have been attributed to the drop in oil prices, causing investors to either sell off their investments in oil or other commodities to fund losses. With the speculated recovery in February and April, investors were buying back the now cheap oil and commodities.
The sudden diversion of Energy and Commodity volumes in the recent reports of June and July appears to be indicating that despite prices remaining correlated, traders are changing their portfolios habits. The result is that oil is being sold off again, without the need to sell off commodities in tandem. This means many investors expected oil prices to drop again, and adjusted for that risk, ending the yearlong correlation of energy and commodities for now.
Singapore Independent Wealth Sector Has Less Than 10% Market Share, but Vast Room for Growth
FP Markets Winner Spotlight 🏆 | Global Broker of the Year 2025 #Trading #Broker #Innovation #Shorts
FP Markets Winner Spotlight 🏆 | Global Broker of the Year 2025 #Trading #Broker #Innovation #Shorts
FP Markets takes the spotlight as Global Broker of the Year 2025 at the Finance Magnates Awards.
Martin Stoilov, Head of Client Experience, shares that trust, innovation, and people played a key role in the company’s success, supported by a strong foundation of integrity and client-centricity.
Following this milestone, FP Markets continues to focus on growth, technology investment, and its core values of transparency and excellence.
👉 Be part of FM Awards 2026: https://awards.financemagnates.com/#nominate
In this video, we review @HolaPrimeMarketsOfficial, a multi-asset forex and CFDs broker offering different account types, trading platforms, and flexible trading conditions.
We cover the broker’s overall offering, including account options, trading environment, platforms like MT4 and MT5, and additional services such as managed accounts and fast withdrawals.
Watch the full video to see if Hola Prime Markets fits your trading needs.
📣 Stay up to date with the latest in finance and trading. Follow Finance Magnates for industry news, insights, and global event coverage.
Connect with us:
🔗 LinkedIn: /financemagnates
👍 Facebook: /financemagnates
📸 Instagram: https://www.instagram.com/financemagnates
🐦 X: https://x.com/financemagnates
🎥 TikTok: https://www.tiktok.com/tag/financemagnates
▶️ YouTube: /@financemagnates_official
#HolaPrime #ForexBroker #CFDTrading #FinanceMagnates #Trading #Forex #BrokerReview
Hola Prime Review: What You Need to Know | Full Breakdown by Finance Magnates
Hola Prime Review: What You Need to Know | Full Breakdown by Finance Magnates
In this video, we review @HolaPrime_Global, a proprietary trading firm offering evaluation programs and performance-based payouts in simulated market environments.
We cover how the challenge model works, including account types, profit splits (up to 95%), trading rules, and what it takes to reach a funded account. You’ll also learn about available platforms like MT4, MT5, cTrader, and more, along with insights into payouts, support, and trading conditions.
Watch the full video to see if Hola Prime fits your trading style.
📣 Stay up to date with the latest in finance and trading. Follow Finance Magnates for industry news, insights, and global event coverage.
Connect with us:
🔗 LinkedIn: /financemagnates
👍 Facebook: /financemagnates
📸 Instagram: https://www.instagram.com/financemagnates
🐦 X: https://x.com/financemagnates
🎥 TikTok: https://www.tiktok.com/tag/financemagnates
▶️ YouTube: /@financemagnates_official
#HolaPrime #PropFirm #Trading #FinanceMagnates #Forex #FuturesTrading #TradingReview #PropFirmReview
Axi Winner Spotlight 🏆 | Global Most Innovative Broker 2025 #Innovation #Trading #Fintech #Broker
Axi Winner Spotlight 🏆 | Global Most Innovative Broker 2025 #Innovation #Trading #Fintech #Broker
Axi takes the spotlight at the Finance Magnates Awards, winning Global Most Innovative Broker 2025.
Olivia Xenofontos and Ivanna Openko share how the team will feel: proud, motivated, and ready to keep delivering.
They also describe the night as well-organized, focused, and enjoyable for all.
👉 Be part of FM Awards 2026.
Recognition that matters.
Built on transparency.
Driven by the industry.
The Finance Magnates Awards 2026.
Nominations are now open.
🔗 https://awards.financemagnates.com/?utm_source=SM&utm_medium=social&utm_campaign=recognition-matters
Recognition that matters.
Built on transparency.
Driven by the industry.
The Finance Magnates Awards 2026.
Nominations are now open.
🔗 https://awards.financemagnates.com/?utm_source=SM&utm_medium=social&utm_campaign=recognition-matters