Online web based charting provider TradingView today unveiled a new analysis tool, dubbed the ‘Forex Heat Map Widget’, which allows its users to get a quick overview of action in the currency markets, per a TradingView update.
The London Summit 2017 is coming, get involved!
[gptAdvertisement]
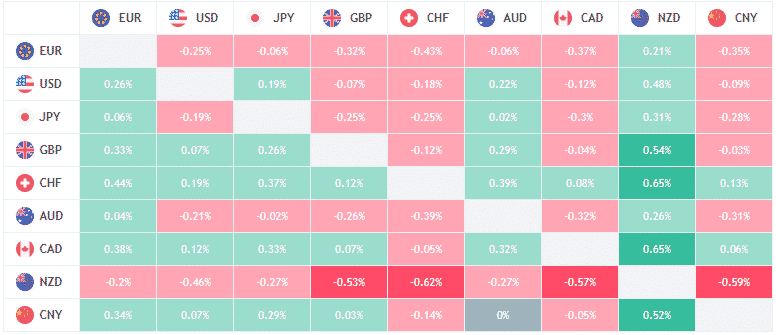
Heat Map widget is a combination of colored rectangles, each representing a currency pair, that allows you to quickly grasp the current status and impact of a large number of variables across several pairings.
In addition, the heat map enables traders to spot currency performance/changes in real-time and how they move broadly in relation to one another. As such, it could be helpful to quickly assess and find trading opportunities.
Probably the most interesting feature in the new tool is that it allows traders to create personal rates tables with just a few clicks by selecting the currencies they want to follow.
The headings along the top and the left side of the rectangles represent a set of major currencies. The color of the rectangles is indicative of their most recent trends.
TradingView is a data-driven community for nonprofessional investors which offers a comprehensive charting tool. The company’s approach differs from other social trading networks because it is chart-based with an emphasis on visuals to support investing and provides communal space to view and share trading ideas.
TradingView also has a web-store where users can purchase access to third-party tools. The company’s solution had already been rising in popularity in recent years as it has successfully marketed itself as a provider of smooth HTML5 charts that encompass a diverse set of asset classes – it’s also one of the largest social network for traders presently.