The FBI Director's announcement and the S&P
The S&P 500 index is currently trading at 2,085.18, down 3.48 points or 0.17%. The index has a 5-day performance of -2.06%. The big news driving the S&P 500 futures is the FBI director’s announcement that no charges would be brought against Hillary Clinton vis-a-vis the email saga.
This is especially important because it drives down the Volatility that is been such an integral component of market behaviour of late. The 9-day decline in the SPX was brought to an abrupt halt after FBI director Comey intimated that Hillary Clinton had not committed a crime when handling your emails. As it stands, contracts for delivery in December 2016 rose 1.4% in the late morning trading session in London.
Financial markets received a much-needed reprieve from the relentless volatility generated by the US presidential election. By Wednesday, 9 November, the S&P 500 index and other global indices will start to take shape in their new direction. A Trump victory will lead to an about turn in market performance while exempting victory is likely to stabilise the financial markets.
The certainty of a Clinton victory is not assured, but the exculpation by Comey is a big boost. As a case in point, the SPX plunged 20 points within the first hour after Comey made his announcement to Congress. One of the most important measures of market sentiment is the volatility index. In 9 days it has gained 73% – the largest spike for decades.
The volatility index, known as the fear index, was down 14% on Monday, 14 November 2016. On a positive note, we are unlikely to see any major swings on the S&P 500 index as a result of Q3 quarterly earnings. Some 85% of all listed companies have provided their earnings reports. The consensus forecast among analysts is that an overall rise in profits will take place, albeit minimal.
Which top and bottom 5 ETFs are driving the SPX?
Recently, the biggest exchange traded funds (ETFs) on the S&P 500 index included the following 5:
- REZ – up 0.93% or 0.56 at 60.66
- FXH – up 0.99% or 0.54 at 55.09
- KBWY – up 1.09% or 0.35 at 32.33
- RYH – up 1.16% or 1.64 at 142.64
- RTM – up 1.17% or 0.98 at 84.52
By contrast, the biggest losers on the S&P 500 index included:
- ECON – down 1.47% or 0.35 at 23.38
- IST – down 1.69% or 0.40 at 23.31
- RETL – down 2% or 0.72 at 35.50
- GRID – down 3.25% or 1.25 at 37.32
- REM – down 74.81% or 30.97 at 10.43
Technical indicators for the S&P 500 index: the trend is bearish
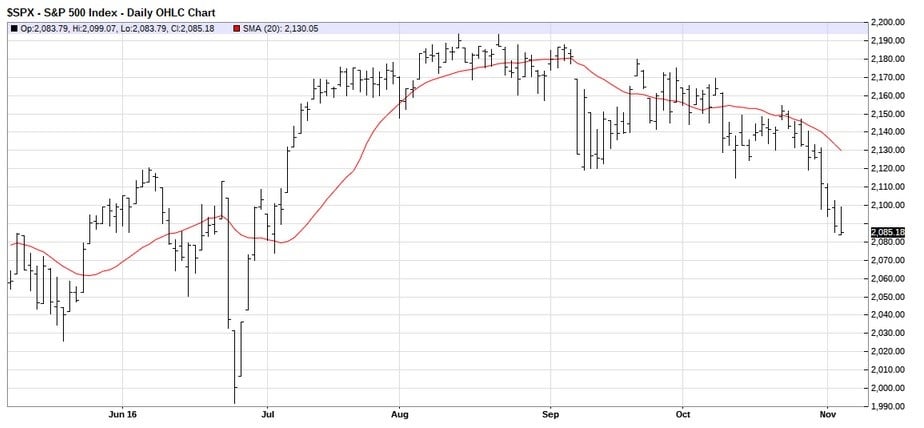
Technical analysis of the S&P 500 index indicates some startling realities. For example, the 5-day moving average is 2,101.93. It has a 1.94% negative change with a 41.23 dip in the price. The 20-day moving average is down 3.18% at 2,130.05. The 50-day moving average is down 4.02%, or 87.29 at 2,147.90. The 100-day moving average is also above the prevailing level of the S&P 500 index. It currently stands at 2,145.22. Beyond 100 days, the moving averages are below the prevailing level of the S&P 500 index.
For example, the 200-day MA is at 2,083.18, up 9.35% or 178.28. For the year-to-date, the moving average is 2,072.86, up 2.02% or 41.24 points. Equities are persona non grata at this juncture, and commodities like crude oil are faring no better. Traders will be cautiously eyeing the outcome of voting in the swing states. These include Pennsylvania, Ohio, Iowa, Michigan, Wisconsin, North Carolina and others. These are seen as an important precursor to the US presidential election outcome.
Traders beware: the volatility index is at a 5-month high
On Friday, 4 November, the S&P 500 index ended lower for the ninth session on the trot. This marks the worst performance in terms of continuous declines for 36 years. Now, some industry analysts are calling for a full on bear market. However, if we extrapolate over time, this sharp selloff is not quite as bad as we have seen over the years. Fortunately, markets have gone through many such rocky patches over time, and the current pattern is hardly a reason for concern.
It is particularly important to stress that a great deal of the volatility we are seeing right now is directly attributed to the US presidential election. The scandals that have enveloped Hillary Clinton’s campaign and Donald Trump’s campaign have erupted into a full-on media frenzy. Markets despise volatility more than anything else. The volatility index (VIX) is up 1.95% at 22.51. This fear gauge is at its highest level since June when Britain voted for a Brexit .
Stocks performed strongly on Friday after the US non-farm payrolls report. This was in stark contrast to the declines that were taking place through the week. One of the notable turnarounds was biotechnology stocks. These have been hit hard recently, but they rebounded somewhat on the day. Another issue which is weighing heavily on the minds of traders is the upcoming December 14 meeting of the FOMC.
The Federal Reserve Bank will be hosting its last meeting of the year and it is expected that a 25-basis point rate hike will be announced. According to the CME Group FedWatch Tool, the likelihood of a rate hike on Wednesday, 14 December 2016 is now at 66.8%. This is the highest probability for the year, and it will be the only rate hike if indeed it comes to pass. Incidentally, the volatility index – VIX – is trending above its 10-year average. It is predicated on options prices for the S&P 500 index.
S&P 500 index plunges over 9 trading sessions
Between October 25 and November 4, there have been 9 successive declines in the S&P 500 index. All the while, one commodity has made strong gains – gold. On Friday, 4 November 2016, the price of gold rose to $1303.30 per ounce, up 0.1%. The current level of the S&P 500 index is at its lowest point since 29 June 2016.
Fortunately, the successive declines are not reflective of the future performance of the index. It is clear that everything is hinging on the outcome of Tuesdays presidential election. In the event that excessive market turbulence is generated by the outcome of the election, the Fed could always hold off on its interest-rate hike. This would prevent a further decline in equities markets.