Bank of Japan
March E-mini NASDAQ-100 futures posted a strong gain last week. Some of the gains came on Friday after the Bank of Japan unexpectedly adopted a negative interest rate policy for the first time. Better-than-expected earnings reports also helped underpin the index as well as stabilization in oil prices.
Although the major indices posted their worst January since 2009, Friday’s close was upbeat, leading to speculation that February will open on a higher note. On a monthly basis, the NASDAQ-100 futures contract fell 7.08% for its worst month since 2010.
The Fed
Central bank activity played a role in last week’s price action. Firstly, the less-dovish-than expected U.S. Federal Reserve’s monetary policy statement on January 27 helped pressure the index. However, Friday’s decision by the BoJ to implement a negative interest rate policy, was welcomed by bullish traders.
The Fed decided not to raise interest rates at its January meeting and gave no indication that it was changing course on the pace of future rate hikes. Traders had priced in the possibility of a delay in future rate hikes because of recent market turmoil. However, amid the turmoil in the financial markets, the Federal Open Market Committee issued a statement that said it was “closely monitoring global economic and financial developments.”
The inability of the Fed to articulate its future plans with clarity and conviction provided the incentive to sell stocks. This line of thinking lasted until Friday when the BoJ said it would apply a negative interest rate of minus 0.1 percent on selected current account deposits that financial institutions hold with it, effectively charging banks interest for holding excess deposits at the central bank.
This BoJ also said it was prepared to make further interest rate cuts into negative territory if necessary. The moves by the BoJ highlighted the divergence between the Fed and the Bank of Japan. This news and hints by the European Central Bank earlier in the month of additional stimulus, helped underpin the March E-mini NASDAQ-100 futures contract.
Oil
The stabilization of crude oil prices also helped support higher equity prices. Although U.S. crude oil supply reached a new all-time high the week ending January 22, the news that OPEC and non-OPEC countries may agree to meet to discuss a reduction in oil production, was perceived as friendly to oil prices. This is still a fragile situation since the countries haven’t even agreed to meet and with Russia apparently holding out.
Nonetheless, the week and the month ended on a positive not that may carry over into next week’s trade. Technically, last week’s price action was supported by the positive developments. It may only be early short-covering, but it does seem to be strong enough to continue over the near-term.
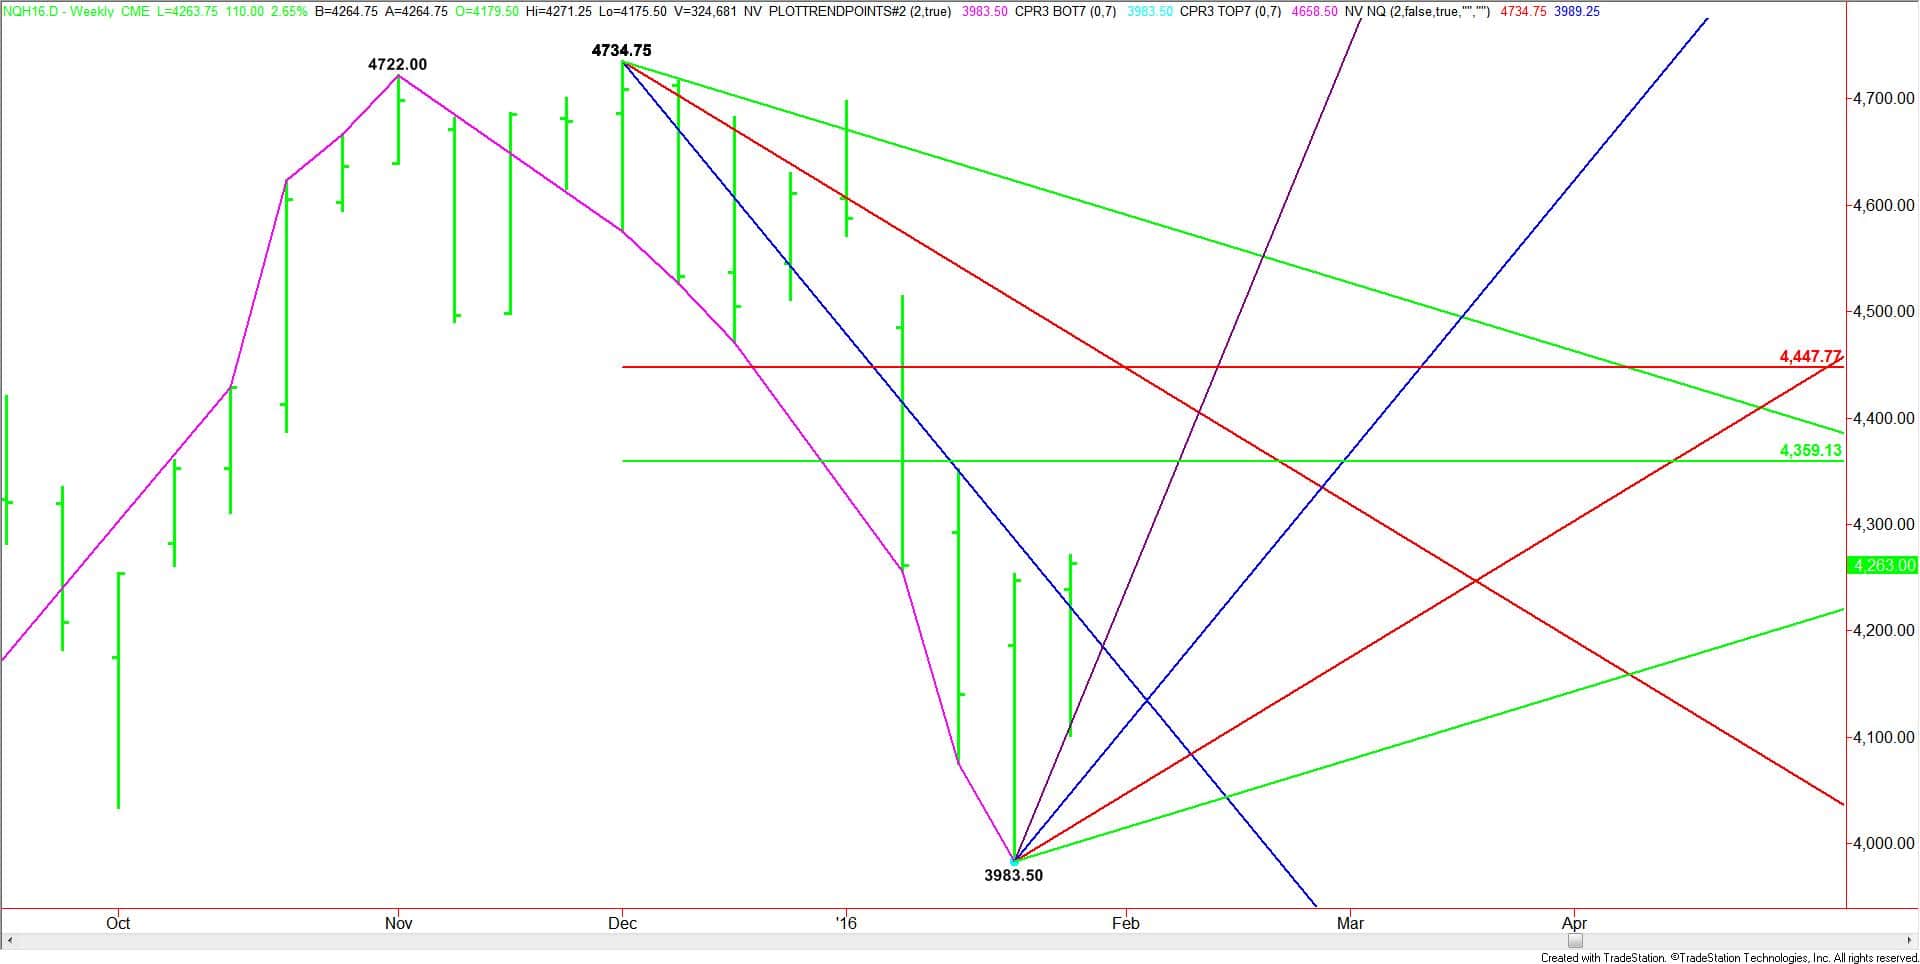
During the week-ending January 15, the March E-mini NASDAQ-100 futures contract formed a potentially bullish closing price reversal bottom. This chart pattern doesn’t mean the trend is changing to up, but it is usually an indication that the buying is greater than the selling at current price levels.
The closing price reversal chart pattern was confirmed on the weekly chart. In addition, the market managed to close over a downtrending resistance angle. Both of these moves are indicative of buying.
Expectations
This week, we’re looking for the short-covering rally to continue with our first objective the main 50% level at 4359.25. Taking out this level could create more upside momentum with possible targets coming in at 4447.75 and 4478.75.
The key is the follow-through move. If buyers don’t come in with conviction early in the week then sellers may take the market back under the nearest support angle at 4239.50.
If the selling pressure continues under 4239.50 then the market may continue to break further into angles at 4111.50 and 4047.50.
Fundamentally, the catalyst behind any rally this week is likely to be rising oil prices. Oil could rally sharply higher if the OPEC and non-OPEC countries decide to meet to discuss the lowering of production levels. Russia will have to join the meeting in order for any decision to become effective.
If the promise of talks fizzles out then oil will likely continue lower, dragging the stock indices with it. I don’t think the move by the Bank of Japan is strong enough to support a strong rally.
We are likely to see two scenarios then week. The first will be negative news regarding the oil production meeting. This should drive the index into support. If the news changes to positive while the index is testing support then look for the start of another rally. If the possibility of the talks completely fails then we probably won’t see a rally.
In the second scenario, the upside momentum created by Friday’s rally continues early this week, leading to a breakout to the upside and an eventual test of the 50% level at 4359.25.
This week, stocks are likely to continue their rally if the OPEC and non-OPEC countries, especially Russia, agree to meet to discuss cutting production levels. We’re going to be watching the price action and order flow at last week’s high at 4271.25 to see if last week’s buying is getting stronger. We’re also going to be watch for bullish news to emerge if the market pulls back into support.