Anesu is the founder of BOeducator, a binary options education site dedicated to equipping traders with the tools they need to be self-reliant in trading. He holds a Diploma of Share Trading and Investment, a Diploma of Financial Planning, and is currently studying Electrical and Electronics Engineering.
Support and Resistance

Anesu C. Mpala
Support and resistance are concepts that are very important in technical analysis and widely used in trading. It is crucial to understand these concepts and integrate them into price analysis and chart patterns. The most common support and resistance levels are created by previous peaks and troughs and many traders tend to misuse them mainly because these levels are easy to identify on a chart.
Many traders tend to enter into a trade as soon the price cuts through or bounces off a resistance level. Likewise, a bounce or a breach of the support level is considered an entry signal. However, this style of trading if used in isolation is not recommended-false breakouts mean this approach is inconsistent.
So what are support and resistance levels?
Support
A support level is a point or zone where prices stop dropping. This is caused by either equilibrium (when there are equal buyers and sellers in volume on the markets), or disequilibrium (when buyers outnumber the sellers). For example, if there is no one willing to sell, yet there are traders who are willing to buy, there is disequilibrium and the price starts to go up. Support levels are commonly established in this manner.
Additionally, new buyers entering the market, outnumbering sellers, also create disequilibrium. This level is mostly noted by traders from a previous point were the price stopped falling.
A breach of this level informs traders of a strong downtrend and Leads to increased selling and prices falling. Once the support level is breached, many traders will be looking to sell at this level when the price bounces back. Therefore, the support level will become a resistance level. The strength of a support level is determined by the number of times the price stopped falling at that support level.
The picture below shows a weekly chart for NewsCorp with a previous resistance that has been broken to form a new support level.
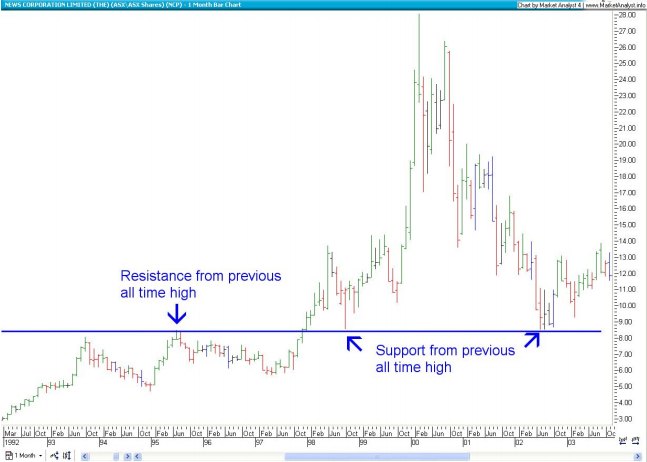
Source: Market Analyst 7
Resistance
A resistance level is a zone were the price struggles to continue rising. As before, this is due to either equilibrium or disequilibrium in the markets. In this case, there are either equal volumes of buyers and sellers, or more traders willing to sell at this level than those who want to buy.
A rise through a resistance level indicates a continuation of an uptrend, and the support level will then provide support to the price as many traders look at this level. The number of times the price bounces off this level determines the strength of the support level.
The chart below shows a number of resistance levels being breached to form a new support level for the monthly chart of Publishing & Broadcasting.
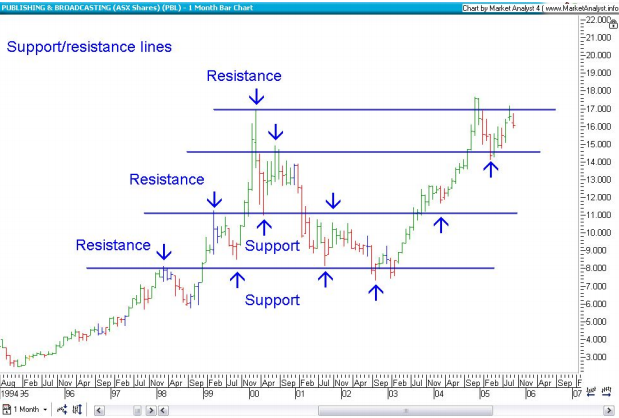
Source: Market Analyst 7
Strength of Support and Resistance Levels
The strength of these levels is dependent on a number of factors. Firstly, as outlined before, the number of times the price bounces off each of these levels determines the strength.
The strength is also established by the length of time between a support and a resistance. A support level tends to be stronger if there is a big difference in time between two troughs and two peaks for a resistance level.
Furthermore, round numbers usually provide stronger support and resistance as they are easier to remember, causing a psychological reaction in traders.
Lastly, traders are more likely to remember newly created support and resistance levels, another reason that the price has a high probability of stopping at these levels.
Support and resistance levels are vital in making trade decisions and technical analysis as they give traders an insight into where the price is likely to stop moving, and possible trend reversal zones.
In my next article, I will discuss how to predict areas of support and resistance.