
When I analyzed gold's technical chart last week, I identified $4,550 and $4,360 as the next downside targets and the 200-day EMA at $4,200 as the critical bull/bear dividing line. I did not expect those targets to be tested within days.
Gold has now fallen for nine consecutive sessions , losing approximately 15% from March's $5,100 highs and touching as low as $4,100 per ounce during Monday's intraday session before rebounding to $4,260 as the 200 EMA provided initial support. Silver has simultaneously collapsed to $64 per ounce, its lowest level since December 2025.
In this article, I will break down my updated XAU/USD technical analysis for both gold and silver, examine why the crash is happening, and present the most relevant price predictions for the rest of 2026. Based on my over a 15 years of experience as an analyst and retail investor, here is what I am watching.
Follow me on X for real-time gold and silver market analysis: @ChmielDk
Why Gold Is Crashing? Nine Sessions, One Explanation
The chain of causation is now well-established. The Federal Reserve's March 18 hawkish hold - cutting 2026 rate cut projections from two to one while citing persistent oil-driven inflation - broke the monetary policy thesis that had underpinned gold's entire rally from $2,600 to $5,600.
As Tony Sage, CEO of Critical Metals, puts it: "Interest rate cuts are no longer expected in the US, while other central banks are seen as likely to hike interest rates in their upcoming meetings, weighing down on non-yielding assets like gold."
- Why Is Gold Crashing? How Low Can XAU/USD Chart Go and Gold Price Prediction 2026
- Why Gold Is Falling? XAU/USD Price Tests $5,000 After Strongest Drop in a Month
- Gold Price Prediction 2026: How High Can Gold Really Go?
The oil-inflation-rates transmission is the core mechanism. The Strait of Hormuz situation continues to keep Brent crude elevated, reigniting inflation fears that force the market to price in higher-for-longer rates.
The Dollar Index has surged in response, making gold - priced in dollars - simultaneously more expensive for international buyers and less attractive relative to yield-bearing US assets. As one Allianz scenario model noted, oil above $100 per barrel could add 0.5 percentage points to US inflation, enough to keep real yields elevated and gold under sustained pressure.
The Russia-dollar pivot report from mid-February added a structural dimension to the selling. If Russia returns to dollar settlement, one of the key de-dollarisation narratives that drove central bank gold buying over the past two years loses force. The market is now questioning whether the structural demand story that justified $5,600 gold was partly a narrative premium rather than a durable fundamental.
XAU/USD Technical Analysis: Gold at the 200 EMA - The Last Line
As my chart shows, gold has done in a week what I expected might take a month. The previous gold analysis identified $4,550 and $4,360 as sequential bear targets with the 200-day EMA at $4,200 as the critical bull/bear dividing line. Both intermediate targets have been blown past without meaningful support. Gold touched $4,100 intraday on Monday before rebounding to $4,260, with the 200 EMA providing the first genuine buying response.
This is technically significant. Officially, the uptrend remains intact - the 200 EMA has not been broken on a daily closing basis, and that is the only level that matters for trend classification. Gold has not closed below the 200 EMA since late 2023. But the intraday penetration to $4,100 is a warning. If Monday closes below $4,306 - the October 2025 historical highs - further downside becomes increasingly likely.
The next sequential targets on my bear scenario are $3,925 (the November 2025 lows) and ultimately my extreme bear target at $3,500 - the June 2025 highs from which the near-uninterrupted rally to $5,600 began. From Monday's $4,260, that extreme scenario represents a further decline of approximately 18%.
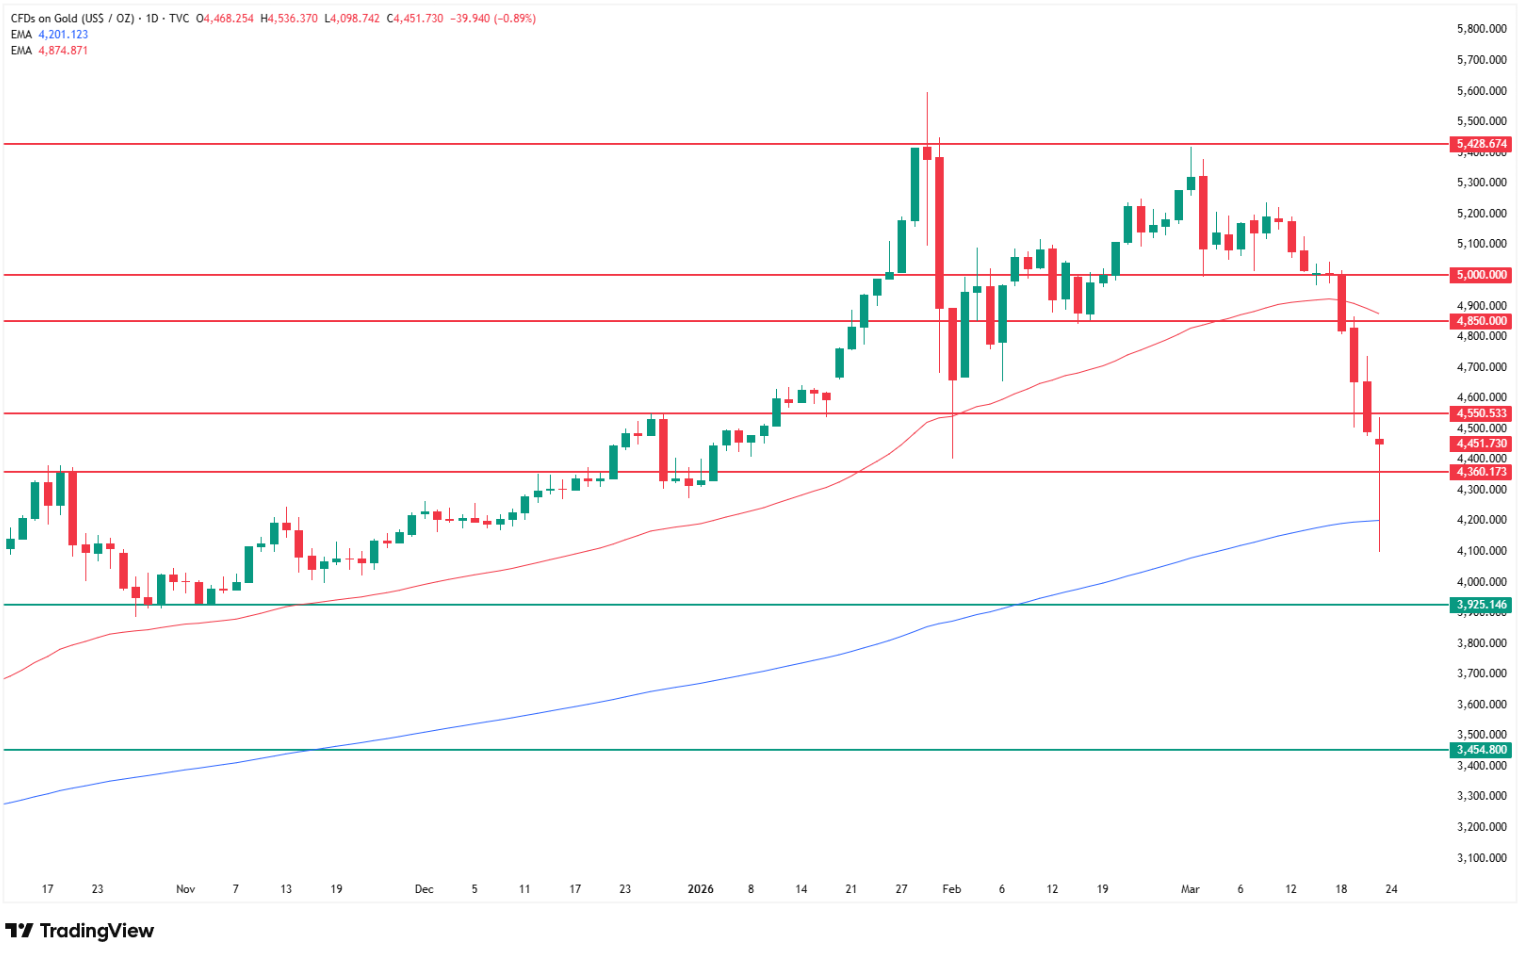
For the bull case to reassert itself, gold needs to reclaim $4,550 - the late 2025 historical highs - which would open the path back toward the consolidation near the all-time highs at $5,600. A recovery to $4,300 alone is insufficient. The market needs to demonstrate it can hold and build above $4,550 before any recovery thesis becomes credible.
Level | Type | Notes |
$5,600 | All-time high (Jan 2026) | Gold -24% from here |
$5,100 | March high | 15% decline from here |
$4,550 | Bull recovery trigger | Late 2025 highs - must reclaim |
$4,306 | Key closing line | Oct 2025 highs - below here = more risk |
$4,260 | Current price (Mar 23) | 200 EMA acting as support |
$4,200 | 200-day EMA (bull/bear line) | Last closed below: late 2023 |
$3,925 | Bear target 1 | November 2025 lows |
$3,500 | Extreme bear target | June 2025 highs, -18% from current |
Silver Below $70 - The Support Has Flipped
The silver situation is evolving in parallel but with even greater urgency. As I wrote in the silver crash analysis from last Friday, the $70 level was the critical lower boundary - tested and held three times since the start of 2026. On Monday March 23, that support has been broken. Silver is trading at $64 per ounce, down nearly 6% on the day and at its lowest level since December 2025.
The most important technical development on the silver chart is this: $70 has now officially flipped from support to resistance. Three successful defences of a level, followed by a break, typically produce the most decisive directional moves in technical analysis because all the buyers who trusted that support are now trapped, creating additional selling pressure on any rally that approaches $70 from below.
The 200-day MA at $62 is the next meaningful support, and it mirrors exactly what gold is doing at its own 200 EMA. Silver has not yet produced a daily close below its 200 EMA, so officially the uptrend remains intact - but the margin is thin.
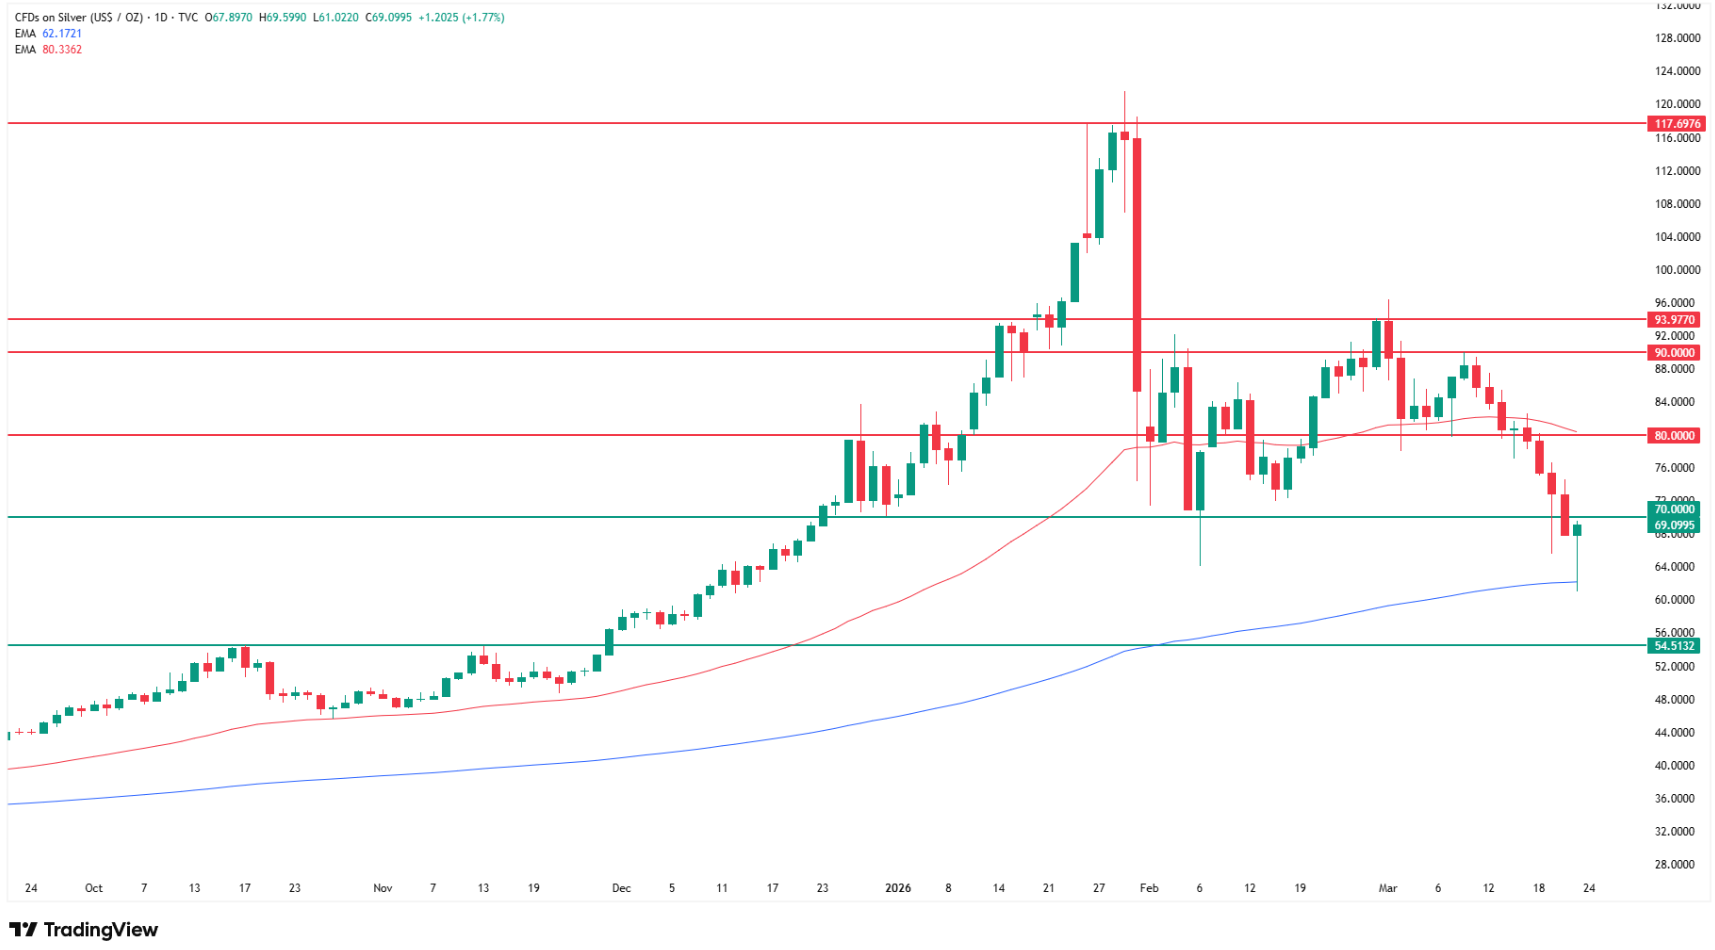
My next sequential bear targets are $55 per ounce (the October 2025 historical highs) and if that fails, the extreme scenario opens up considerably further downside. A recovery, when it comes, needs to clear $70 first, and more convincingly $80 where the 50-day MA runs, to generate genuine confidence that triple-digit silver prices are back in play.
Below $80, even if silver stabilises, I expect further corrective pressure given how aggressively the market is positioned short on precious metals right now.
Level | Type | Notes |
$121 | All-time high (Jan 2026) | Silver -47% from here |
$80 | Recovery confirmation | 50 EMA, bull conviction zone |
$70 | Broken support / now resistance | Held 3x, now flipped |
$64 | Current price (Mar 23) | -6% Monday, 5-month low |
$62 | 200-day EMA | Next meaningful support |
$55 | Bear target | Oct 2025 historical highs |
Is This the End of the Bull Market? The Expert Views
Rania Gule, Senior Market Analyst at XS.com, urges against a purely technical reading of the current situation: "This phase cannot be assessed solely through technical analysis or short-term price movements - it must be viewed within a broader macroeconomic framework."
She maintains that "gold continues to hold strong structural bullish momentum supported by solid fundamental drivers, most notably ongoing global economic uncertainty and rising institutional demand for hedging." Her framing of the current decline as a "necessary correction to rebuild long positions" is the institutional consensus view.
The structural supports that Gule cites are real. Central bank gold purchases remain near record levels. US fiscal deficits show no sign of narrowing. The geopolitical environment is genuinely elevated. GoldSilver.com's March report makes the case directly: "The structural case hasn't changed - central banks are still buying, the dollar outlook is still soft long-term, US fiscal deficits aren't shrinking".
But there is a meaningful minority making the structural bear case. Bloomberg Intelligence's Mike McGlone had warned earlier this month that gold's surge "to multiyear extremes vs. most moving averages and broad commodities may suggest the store of value has shifted to a speculative risk asset."
That framing - gold as momentum trade rather than structural allocation - is gaining credibility with every additional session of selling. If institutions begin treating gold as a crowded momentum position rather than a portfolio hedge, the unwind can be faster than any fundamental deterioration alone would justify.
Gold and Silver Price Predictions 2026: The Revised Landscape
The institutional forecasts that dominated coverage in January and February are now being stress-tested against the reality of a 15-month low on gold and a 47% decline from January's silver peak. Some have been revised. Others are holding firm.
At the bearish institutional end, Capital Economics' Hamad Hussain targets $3,500 for year-end gold - a scenario that requires the bull market to be definitively over and the 200 EMA to be broken convincingly. Macquarie forecasts an average 2026 gold price of $4,323, implying the current level is broadly fair value with limited upside. NAGA's bear scenario, assigned a 20% probability, targets $3,900-$4,300. State Street's bear case (20% probability) sits at $3,500-$4,000, driven by dollar stabilisation and a return to growth momentum.
The bulls have not surrendered. Goldman Sachs maintains its $6,000 year-end target, requiring a Fed pivot and central bank demand acceleration. NAGA's bull scenario (50% probability) targets $4,500-$5,500. State Street's base case (50% probability) targets $4,000-$4,500 - which is essentially where gold is trading right now, suggesting the market has arrived at fair value rather than oversold territory.
Source | Gold Target 2026 | Probability |
Capital Economics (Hussain) | $3,500 | Bear case |
Macquarie | $4,323 average | Base case |
NAGA bear scenario | $3,900-$4,300 | 20% |
State Street bear | $3,500-$4,000 | 20% |
State Street base | $4,000-$4,500 | 50% |
My chart (bear targets) | $3,925 then $3,500 | Sequential support |
JP Morgan | $5,000 (Q4) | Bull case |
NAGA bull scenario | $4,500-$5,500 | 50% |
Goldman Sachs | $6,000 | Full bull case |
Robert Kiyosaki | $35,000 | Post-bubble-bust |
FAQ
Why is gold crashing in March 2026?
Gold has fallen for nine consecutive sessions - down approximately 15% from its March high of $5,100 - following the Federal Reserve's March 18 hawkish hold that cut 2026 rate cut projections from two to one. The Strait of Hormuz oil shock reignited inflation fears that keep real yields elevated and the dollar strong, both direct headwinds for non-yielding gold. T
How low can gold go?
As shown on my chart, gold is currently testing the 200-day EMA at $4,200 - the bull/bear dividing line that has not been breached on a closing basis since late 2023. A sustained close below $4,306 (October 2025 highs) would activate my next sequential targets: $3,925 (November 2025 lows) and the extreme bear case of $3,500 (June 2025 highs), representing approximately 18% further downside from Monday's $4,260.
How low can silver go?
Silver has broken below the critical $70 support level that held three times in 2026, trading at $64 per ounce on Monday March 23. That $70 level has now flipped to resistance. My next targets on the bear scenario are the 200-day MA at $62 and then the October 2025 historical highs at $55 - approximately 14% further downside from current levels. A close below the 200 EMA would be a materially bearish signal, as the current trend structure has not yet produced one.
Is the gold and silver bull market over?
Not officially - neither metal has closed below its 200-day EMA, which is the structural line that separates bull from bear trend on my chart. Rania Gule of XS.com argues that "gold continues to maintain strong structural bullish momentum" with central bank buying, fiscal deficits, and geopolitical risk all still intact.


