

Bitcoin (BTC) price is doing something it has not done since October 2025: rising for eight consecutive sessions. On Monday, March 16, it is testing $74,500 per coin, the highest price since February 4, nearly a month and a half ago, and the move has cleared both the upper boundary of the six-week consolidation and the 50-day EMA in the process.
This is the most constructive technical development of 2026 so far, and it deserves to be taken seriously. It also deserves to be contextualized honestly, because the main trend on the Bitcoin chart remains down, the 200 EMA is still 20% away, and the Fibonacci extension from this year's declines is pointing somewhere very uncomfortable.
In this article, I will break down BTC/USDT technical analysis, examine what the breakout means and what it does not mean, and compile the most relevant Bitcoin price predictions for the rest of 2026. Based on my over 15 years of experience as an analyst and retail investor, here is what I am watching.
Follow me on X for real-time crypto market analysis: @ChmielDk
Why Bitcoin Is Going Up? The Breakout Mechanics
Sunday's 2.2% gain was the move that mattered. It pushed Bitcoin above the $70,000-$72,000 upper boundary of the consolidation range that had capped every rally attempt since early February, and Monday's follow-through above the 50 EMA confirmed the breakout rather than dismissing it as a wick.
The gains throughout this eight-session run have been modest individually - this is not the kind of explosive move that gets breathless coverage - but the cumulative effect is what counts. Bitcoin has quietly climbed from the $66,000 lows of the Iran war selloff to $74,500 without a single red session.
- How High Can Bitcoin Go? Trump's BTC Price Prediction Says It Will Hit $1 Million
- Bitcoin Price Prediction 2026: Can BTC Hit $225K or Will Fall to $75K?
The catalyst mix is a familiar one. As the earlier analysis covering Bitcoin's $72K surge noted, the combination of deeply negative funding rates being flushed out, recovering ETF inflows, and Clarity Act regulatory optimism has driven each of Bitcoin's meaningful bounces in 2026. The same cocktail is present now, with the added technical tailwind of a clean consolidation break providing momentum for systematic buyers and algo strategies to add exposure.
Paul Howard, Senior Director at Wincent, frames the broader context precisely: "If geopolitical tensions such as the conflicts in Iran or Ukraine were to ease and commodities like oil and gold begin to stabilise, Bitcoin could enter a particularly strong phase in the second half of the year."
Under those conditions, he believes "risk assets would likely be reintroduced into portfolios, potentially pushing Bitcoin toward the psychologically significant $100,000 level." The second half caveat is important - Howard is not calling this rally the beginning of a new bull market, but he is identifying the conditions that could make one possible.
BTC Technical Analysis: What the Breakout Actually Means
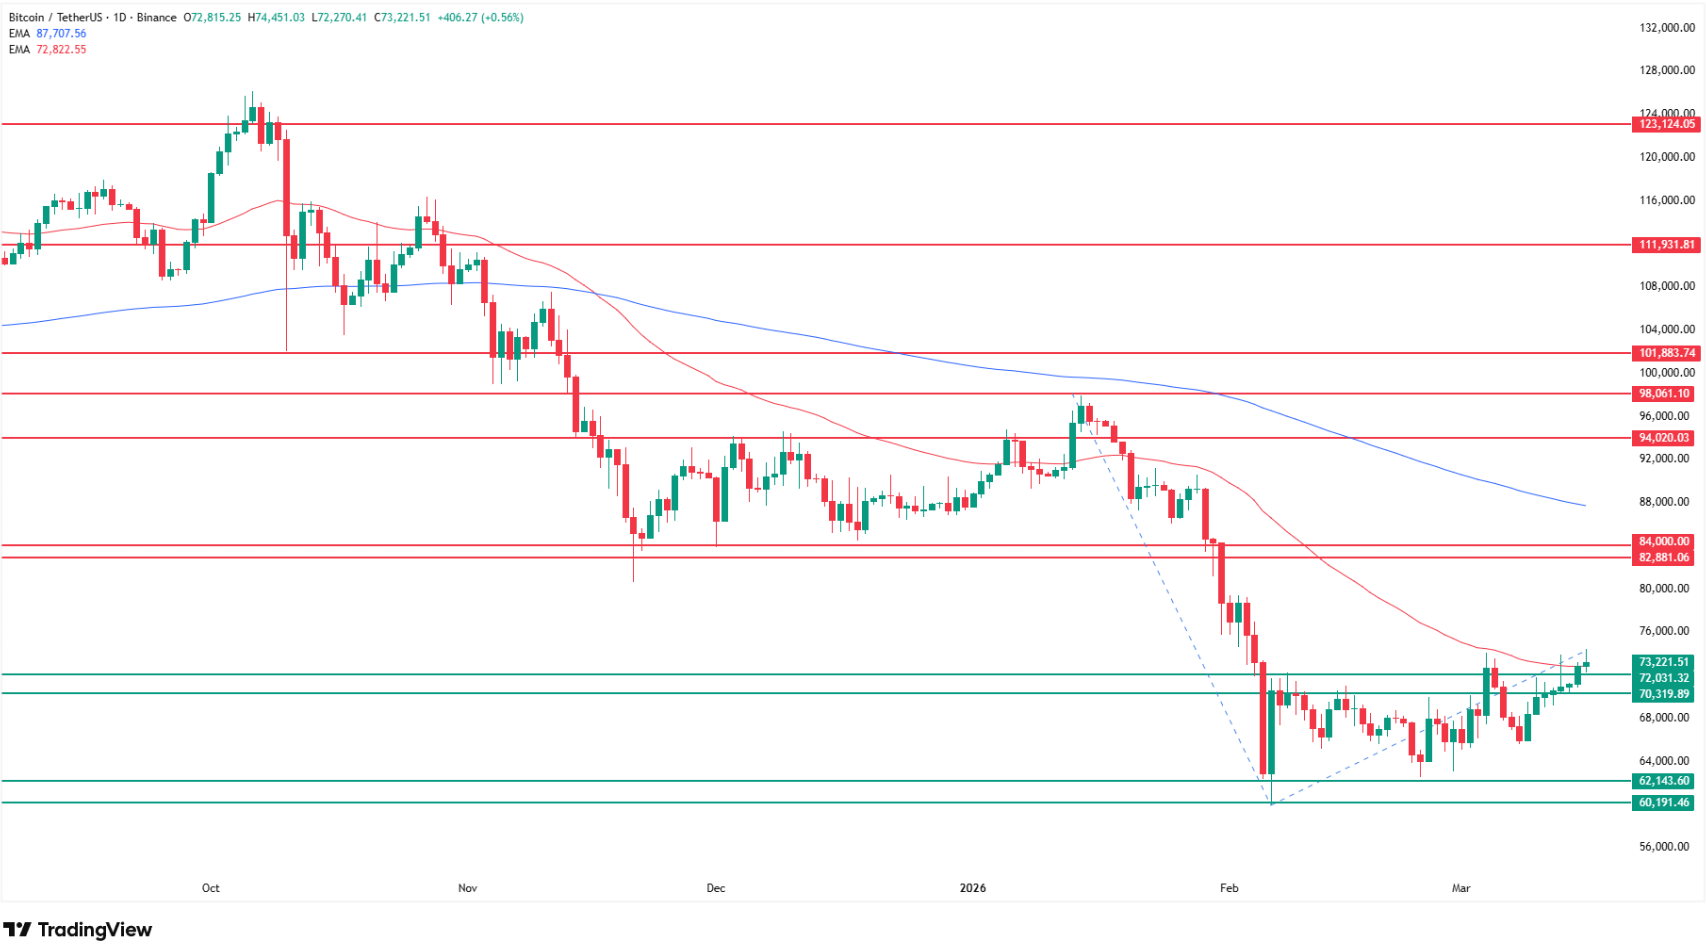
As my chart shows, Bitcoin has broken above the $70,000-$72,000 zone - the upper boundary of the consolidation that has defined this market since early February. The simultaneous clearance of the 50-day EMA gives the move technical validity and should, according to the principle of polarity change, see that zone now act as support on any retest from above.
If Bitcoin holds above $70,000-$72,000 on such a retest - and that is still an "if" - the path opens toward my next key target: $82,000-$84,000. That zone marked the late 2025 lows, formed a significant floor on the chart during the late stages of last year's bull run, and now functions as meaningful overhead resistance that accumulated sellers need to be absorbed. A clean break through $82,000-$84,000 would then set up the test that matters most on my entire chart: the 200-day EMA near $88,000.
That level is the one I have been watching as the dividing line between bull and bear territory since this correction began. We are still 20% away from it. Until Bitcoin reclaims $88,000, this is a correction within a downtrend, not a trend reversal. The February 26 analysis calling for $88,000 as the confirmation level remains unchanged.
The Fibonacci extension is the part of my analysis that tempers enthusiasm most directly. Measuring from this year's peak-to-trough decline and the current corrective bounce, the 100% extension falls at $36,000 - the lowest Bitcoin prices since November 2023. That level becomes relevant only if the corrective rally fails and selling resumes with new force, but it sits on my chart as an honest structural target that the market's own mathematics is producing.
Level | Type | Notes |
$126,000 | All-time high (Oct 2025) | BTC down 41% from here |
$88,000 | 200 EMA (bull/bear line) | 20% above current price |
$82,000-$84,000 | Key resistance | Late 2025 lows, prior floor |
$74,500 | Current price (Mar 16) | 8-session win streak, 6-week high |
$70,000-$72,000 | Broken consolidation / new support | 50 EMA also here on retest |
$60,000-$62,000 | Primary support floor | Must hold to keep bull case alive |
$50,000 | Bear target | August 2024 lows |
$36,000 | Fibonacci 100% extension | Nov 2023 levels, extreme bear |
The Case for Caution: This Is Still a Counter-Trend Move
@CryptoSpotter05 puts the crowd sentiment problem cleanly: "A lot of influencers are now calling for BTC to reach $80K. Those same influencers were calling for $40K not long ago." The speed with which the narrative flips from maximum bearishness to $80K targets is itself a cautionary signal. He adds that he "still feels the worst may not be over" and that the current move may be forming a lower high within the broader bearish structure - precisely the scenario my Fibonacci extension supports.
🚨 $BTC Update & A Reminder
— Crypto Spotter (@CryptoSpotter05) March 13, 2026
I know a lot of influencers are now calling for $BTC to reach $80K.
Funny enough, those same influencers were calling for $40K not long ago. Now suddenly the tone has changed.
But remember, I shared this idea a month ago on Feb 11, when the market… https://t.co/q8hx3C1svC pic.twitter.com/3nXL4jwIXi
@DaitoCrypto aggregates several institutional bear views worth noting. Fidelity Global Macro director Jurrien Timmer says "the bear cycle isn't over and Bitcoin's bottom may be near $60,000." Tech analyst Crypto Patel warns of more downside with average realised buys at $54,400, a level that functions as a gravitational centre if the market revisits where most holders are underwater.
Fidelity Global Macro director Jurrien Timmer says the bear cycle isn't over and Bitcoin's bottom may be near $60,000. Tech analyst Crypto Patel warns of more downside with average realized buys at $54,400. CryptoQuant analyst Darkfost projects the next BTC ATH in early Feb 2028.
— Daito (@DaitoCrypto) March 14, 2026
CryptoQuant analyst Darkfost delivers the most structurally bearish long-term view, projecting the next Bitcoin all-time high in early February 2028 - meaning over 18 months of further consolidation or decline before the cycle truly turns.
Bloomberg Intelligence's Mike McGlone, cited by @iamalijandro, sits at the extreme end: he is "reiterating his pessimistic forecast that Bitcoin could fall below $10,000 amid a macroeconomic reassessment of risk assets."
🗣️ Mike McGlone, Senior Commodity Strategist at Bloomberg Intelligence, reiterated his pessimistic forecast, suggesting that $Bitcoin could fall below $10,000 amid a macroeconomic reassessment of risk assets.
— Alijandro (@iamalijandro) March 14, 2026
However, several market analysts disagree with this scenario, arguing…
That scenario requires a simultaneous collapse in risk appetite, institutional exit, and regulatory reversal that is not the base case of any mainstream analyst, but it underscores how wide the range of credible outcomes remains for Bitcoin in 2026.
Paul Howard of Wincent adds the important nuance that underpins the cautious middle ground: "My personal view remains that Bitcoin is unlikely to reach a new all-time high in 2026." That is a measured statement from someone with a constructive medium-term view, and it aligns with my own reading of the chart.
A recovery to $88,000-$100,000 by year-end is possible. A new all-time high above $126,000 in 2026 requires a sequence of events - Fed pivot, Clarity Act, geopolitical stabilisation, and ETF flow resumption - that is asking a lot from a single calendar year.
Bitcoin Price Predictions 2026: Where Analysts Stand
The institutional consensus for 2026 has shifted materially since October's all-time high, with most credible forecasts now clustering in the $60,000-$100,000 range rather than the $150,000-$200,000 targets that populated research notes last year.
At the bullish end, Standard Chartered's Geoff Kendrick maintains a $200,000 target for this cycle but has pushed the timeline out. VanEck's Matthew Sigel sees $180,000 as achievable before the cycle ends, while Bernstein targets $200,000 by end of 2025 - a forecast that has already been proven wrong, suggesting the timeline needs adjustment.
Paul Howard of Wincent represents the institutional middle ground, seeing $100,000 as achievable in H2 2026 under the right macro conditions but doubting a new all-time high this year.
At the bearish end, the earlier analysis covering the $50,000 primary bear target remains structurally valid as long as Bitcoin trades below the 200 EMA. My own Fibonacci extension at $36,000 sits below even JP Morgan's bear case and requires a genuine macro dislocation to activate.
Source | BTC Target | Timeframe |
Mike McGlone (Bloomberg) | Below $10,000 | Macro reassessment |
Marko Kolanovic (ex-JPMorgan) | $50,000 | 2026 speculative unwind |
Fidelity (Timmer) | $60,000 bottom | Cycle low estimate |
My chart (Fibonacci 100%) | $36,000 | Extreme bear projection |
My chart (bear case) | $50,000 | August 2024 lows |
My chart (next target) | $82,000-$84,000 | If $72K holds as support |
Paul Howard (Wincent) | $100,000 | H2 2026, macro-dependent |
Standard Chartered | $200,000 | Full cycle target, timeline shifted |
The earlier piece on how high Bitcoin can go noted that large wallets accumulated 53,000 BTC on-chain during the February lows, that accumulation zone at $60,000-$67,000 is now well below the market. Those holders are sitting on paper gains and provide a floor of conviction that was absent during the initial selloff. The question is whether institutional ETF flows return with enough force to sustain the breakout above $72,000, or whether Monday's high at $74,500 becomes the lower high that @CryptoSpotter05 warned about a month before anyone else was watching for it.
FAQ, Bitcoin Price Analysis
Why is Bitcoin going up today?
Bitcoin is rising for the eighth consecutive session, testing $74,500 after Sunday's 2.2% move broke the six-week consolidation above the $70,000-$72,000 upper boundary and cleared the 50-day EMA. The technical breakout triggered systematic buying as momentum strategies added exposure, while recovering ETF inflows and Clarity Act optimism provide the fundamental backdrop.
How high can Bitcoin go from here?
As shown on my chart, the immediate target following the consolidation break is $82,000-$84,000, the late 2025 lows that acted as a significant floor and now represent overhead resistance. Beyond that, $88,000 (200 EMA) is the level I need to see broken for any conviction about a genuine trend reversal - we are currently 20% below it.
How low can Bitcoin still go?
Despite the eight-session winning streak, the main trend remains down. My Fibonacci extension from this year's decline projects $36,000 as the 100% extension - the lowest Bitcoin price since November 2023 - if the current corrective rally fails. Fidelity's Jurrien Timmer sees the bear cycle bottom near $60,000, while Crypto Patel warns of more downside with average realised buys at $54,400 as a gravitational centre.
Is this the start of Bitcoin's recovery or a dead-cat bounce?
My chart shows it is too early to call this a recovery. The consolidation break and 50 EMA clearance are genuine technical positives - the first in over six weeks. But as @CryptoSpotter05 correctly warned a month ago when predicting exactly this setup, the current structure is consistent with a lower high formation within a broader downtrend.


