Gold price surged to a new all-time high of $4,568.36 per troy ounce today (Monday), January 12, 2026, rising 1.28% as investors fled to safe haven assets amid an unprecedented crisis at the Federal Reserve. Silver outperformed with a dramatic 4.54% surge to $83.58, extending its extraordinary rally that has seen the white metal gain 181.78% over the past year.
The precious metals surge came after federal prosecutors opened a criminal investigation into Fed Chair Jerome Powell, raising alarming questions about central bank independence and triggering a flight to safety across global markets.
In this article, I explain why gold prices are rising and what is driving the recent gains in silver. I analyze the XAU/USD and XAG/USD charts and examine how high gold and silver could climb in 2026, based on expert forecasts.
Why Gold Is Surging? Fed Independence Crisis
Gold surged to a new all-time high of $4,563.61 per ounce on Monday, January 12, 2026, rising more than 1% as spot prices hit their first record high of the year. The rally was propelled by safe-haven demand following an unprecedented development: federal prosecutors have opened a criminal investigation into Federal Reserve Chairman Jerome Powell.
Powell revealed Sunday evening that the U.S. Department of Justice had issued subpoenas to the Federal Reserve and threatened a criminal indictment related to his testimony before the Senate Banking Committee in June 2025 concerning a $2.5 billion renovation of the Fed's Washington, DC headquarters. In a remarkable video statement, Powell characterized the investigation as a "pretext" stemming from his ongoing conflict with the Trump administration over interest rates.
"The threat of criminal charges arises from the Federal Reserve determining interest rates based on our best judgment of what serves the public, rather than aligning with the President's preferences," Powell stated in his late Sunday announcement.
In the meantime, silver rocketed 4.54% to $83.58 per troy ounce.
In response to the dynamic growth of precious metals, retail trading firms, including CFD brokers, are reacting. Some are raising the available leverage, while others are warning against excessive volatility.
Gold Technical Analysis: $5,000 Next Target
As a result of the above, gold is entering the price discovery phase again. However, today's close above the previous ATH will be crucial. This will be confirmation that gold is ready to continue climbing northward.
How high? Technical analysis does not provide us with a crystal ball. However, using Fibonacci extensions, we see that the potential level for further growth coincides with the $5,000 threshold, where the 100% extension falls. Many large financial institutions also mention this level in their analyses and forecasts.
As I show on my chart, the October peak around $4,360 and the 50-day exponential moving average (50 EMA) around $4,255 per ounce will serve as important support levels.
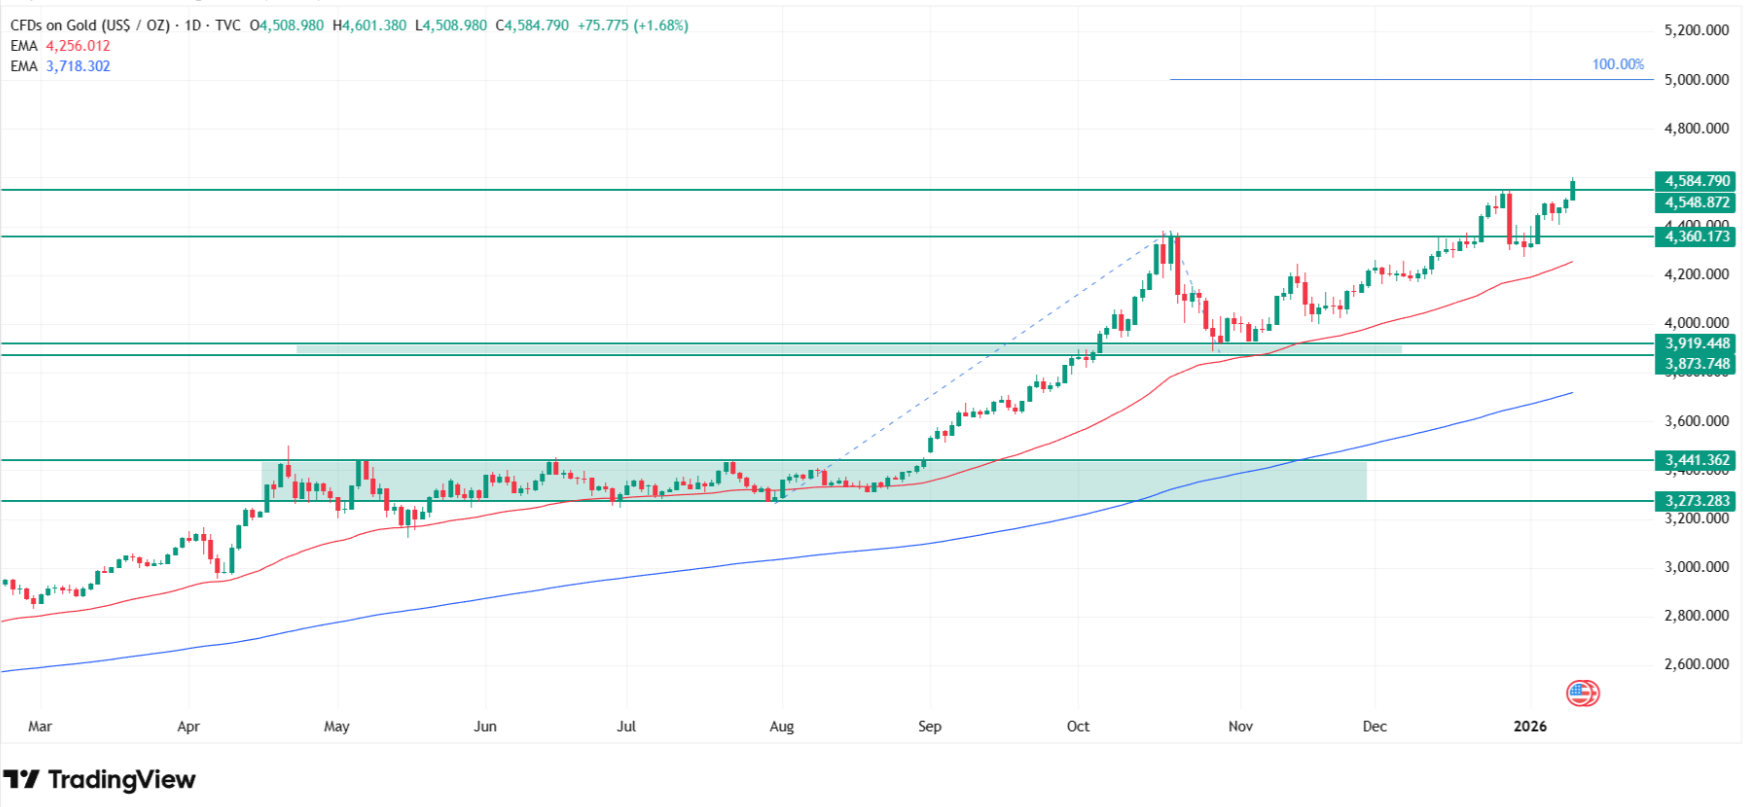
At the same time, according to my technical analysis, bulls will only have reasons for concern after a decline below $3,730 per ounce, where the 200-day exponential moving average (200 EMA) currently sits. This would be a signal for me that we are returning to a downtrend and a stronger correction will take place.
However, the current enthusiasm suggests that this scenario is very far from being realized.
Key Gold Technical Levels
Current structure:
- Current price: $4,568 (new ATH, price discovery phase)
- Next target: $5,000 (100% Fibonacci extension)
- Support 1: $4,360 (October 2025 peak)
- Support 2: $4,255 (50-day EMA)
- Critical support: $3,730 (200-day EMA - bearish invalidation)
- Trend status: Bullish until break below 200 EMA
Silver Technical Analysis: $88 Target as Metal Outperforms Gold
Silver's chart is rising even more strongly than gold, gaining over 5% on Monday and testing levels above $84 per ounce, slightly exceeding the peaks reached on December 29. the same day when gold reached its previous highs.
Some time ago, I stretched the Fibonacci extension grid on silver's uptrend from April to the October peaks at $54 per ounce, followed by the corrective decline that lasted for the next 2 weeks. It indicated a 100% Fibonacci extension around $72. This target has already been achieved with a significant surplus.
The next target level is the 161.8% extension, which falls a few dollars above current levels, around $88 per ounce. However, some experts have a much more bullish view on silver forecasts relative to the US dollar.
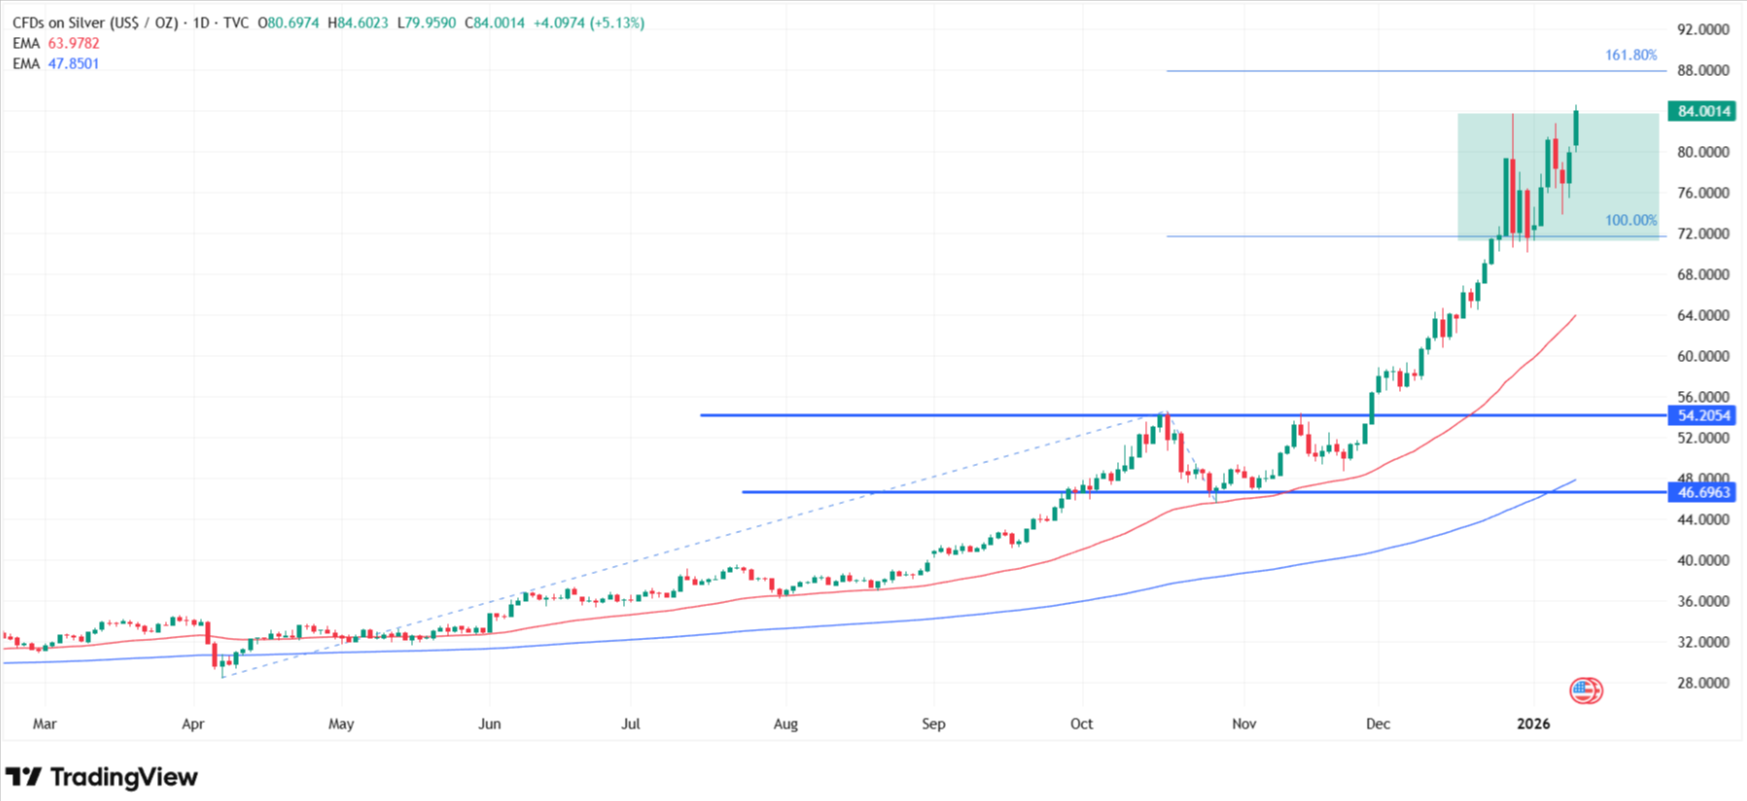
The only thing I would consider dangerous on the chart is the price running away from the main moving averages. The 50 EMA is located around $64, and the 200 EMA around just $48, which shows how dynamic the recent uptrend has been.
It's worth reminding that in 2025, silver gained 150%, and just since the beginning of this year, it's already up another 17%—equivalent to what the S&P 500 gained over the last 12 months.
Key Silver Technical Levels
Current structure:
- Current price: $83.58 (exceeding December 29 highs)
- Next target: $88 (161.8% Fibonacci extension)
- Previous target: $72 (100% Fibonacci - exceeded)
- Support 1: $64 (50-day EMA - significantly below)
- Support 2: $48 (200-day EMA - shows trend strength)
- 2025 performance: +150%
- 2026 YTD: +17% (matches S&P 500's entire 2025 gain)
- Warning: Large distance from moving averages suggests overextension risk
Over the past month, silver's price has risen 30.50%, and is up 181.78% compared to one year ago. This extraordinary performance reflects both safe haven demand and robust industrial fundamentals.
Expert Gold Price Predictions: $5,000-$6,000 Targets
Major financial institutions and expert analysts have released updated gold price forecasts for 2026, with most clustering around the $5,000 level that my Fibonacci analysis targets.
Realistic Scenario: $5,000 Per Ounce
Bogusz Kasowski, professional trader and founder of Surowcowe.info, explains: "Realistic perspective for gold is around $5,000 per ounce, driven by central banks, Federal Reserve, and individual investors."
Rafał Rak, leader of communication at InstaForex, notes that "banks have been modest so far and talked about $5,000. Goldman Sachs and other large institutions as well, but I think they may change recommendations higher."
Extreme Scenario: $6,000+ Per Ounce
The most aggressive forecast relates to potential geopolitical escalation around Greenland. Kasowski explains: "In such a case, $6,000 would be the absolute minimum, because we would have a reshuffling of the entire policy that has functioned since the 1940s."
The scenario envisions President Trump's administration taking military action to acquire Greenland from Denmark. "What does this mean in practice? NATO collapse. This would be an attack on an allied state, Denmark, a NATO and European Union member," Kasowski warns.
Greenland holds strategic significance on the missile route between Russia, China, and the United States, is rich in rare earth metals, and controls the Northern Route—a year-round trade corridor maintained by atomic icebreakers enabling China-Russia cooperation.
"Either you take the money we want to pay you, or we'll enter anyway. This is a situation that will push gold prices up because it would be a total destruction of order when the United States enters the territory of a semi-autonomous NATO state," Kasowski adds.
Major Bank Gold Forecasts
Institution | 2026 Gold Forecast | Key Assumptions |
Goldman Sachs | Central bank buying, Fed cuts | |
JP Morgan Private Bank | $5,055/oz (Q4 average) | Institutional demand 566 tons/quarter |
JP Morgan Private Bank | $5,200-$5,300/oz (potential peak) | Strong safe haven flows |
Deutsche Bank | $4,450/oz (annual average) | Reserve diversification, range $3,950-$4,950 |
Bank of America | $4,538/oz (annual average) | Continuation of 2025 trends |
Goldman Sachs predicts gold will reach approximately $4,900 per ounce by the end of 2026, supported by continued central bank purchases. JP Morgan Private Bank analysts are more optimistic, forecasting an average price of $5,055 in the fourth quarter of 2026, with potential peaks reaching $5,200-$5,300 per ounce.
Deutsche Bank raised its average 2026 gold price forecast from $4,000 to $4,450 per ounce, citing continued diversification of reserves by central banks and stabilizing demand from investors. Bank of America estimates the average 2026 gold price at $4,538 per ounce, assuming central bank and investor purchases averaging approximately 566 tons quarterly.
For retail traders, the challenge is less about identifying the target and more about execution: sizing, drawdown tolerance, and timing entries in volatile conditions. These execution-level questions are increasingly being addressed in live environments, including trader-focused sessions at Dubai’s Trading Festival, where strategies are dissected beyond headline price targets.
Silver Price Prediction: Robert Kiyosaki's $200-$500 Targets
"Rich Dad Poor Dad" author Robert Kiyosaki has been vocal about silver's potential, issuing a series of predictions as the metal rocketed toward $80 in late December.
On December 29, as silver approached $80, Kiyosaki posted on social media: "SILVER BREAKS $80.00. $200 NEXT?" The bold prediction came just before a brief correction that validated his earlier caution.
Two days earlier, on December 28, Kiyosaki had warned followers about "FOMO Fear of Missing Out MANIA" and advised patience: "If you are planning on investing in silver be patient. Wait for a crash then GO or NO." The subsequent pullback from $83 to $70 vindicated that warning, though prices quickly recovered.
Kiyosaki has previously predicted silver would reach $500 from $100 within a year, representing a 5x return for investors who positioned themselves correctly.
Expert Silver Outlook
Rak from InstaForex explains: "Silver can rise more than gold this year, especially since the growth parity hasn't been filled yet and governments haven't stockpiled silver" like they have with gold. This creates significant catch-up potential.
Bogusz Kasowski addresses concerns about market manipulation following exchange margin requirement increases: "We had a reduction from the $83 peak to $70, everyone screamed it was the end of silver and the bull market. But if the price rises 60%, then corrects 15%, we still have plus 45%."
The manipulation attempt on the American exchange, which raised collateral requirements for silver, failed to trigger a market collapse. Kasowski notes the correction was brief, with silver quickly recovering to new highs.
You may also like my previous articles on silver and gold price predictions:
- This New Silver Price Prediction Suggests Precious Metal Can Double to $100 Following Gold Price Rally
- Why Gold Will Hit $10,000? This New Gold Price Prediction Sees the Yellow Metal Doubling
- Gold Price Prediction 2026: WGC Warns of 20% Crash Risk
FAQ: Why Gold and Silver Are Surging
Why is gold surging today?
Gold surged to $4,568 all-time high on January 12, 2026, driven by criminal investigation into Fed Chair Jay Powell raising independence concerns, geopolitical tensions (Iran military operations, Greenland crisis), and safe haven demand. According to my technical analysis, gold entered price discovery phase targeting $5,000 (100% Fibonacci extension) with support at $4,360 and $4,255.
Why is silver surging more than gold?
Silver gained 5% to $83.58 on January 12, 2026, outperforming gold's 1.6% rise. According to my analysis, silver targets $88 (161.8% Fibonacci extension) after gaining 150% in 2025 and 17% in 2026 YTD. matching S&P 500's entire 2025 gain.
How high can gold go in 2026?
According to my technical analysis using Fibonacci extensions, gold targets $5,000 (100% extension). Expert predictions: Goldman Sachs $4,900, JP Morgan $5,055-$5,300, realistic consensus $5,000 driven by central bank buying (566 tons/quarter) and Fed cuts. Extreme Greenland escalation scenario could push gold to $6,000+ per Kasowski analysis from Surowcowe.info.
How high can silver go in 2026?
According to my chart analysis, silver's next target is $88 (161.8% Fibonacci extension) from current $83.58 levels. Robert Kiyosaki predicts $200 near-term and $500 long-term. Experts note silver has upside potential versus gold given governments haven't stockpiled silver like gold, plus strong industrial demand fundamentals supporting structural deficit.
What is gold price prediction for 2026?
Major bank forecasts cluster around $4,900-$5,300: Goldman Sachs $4,900 year-end, JP Morgan $5,055 Q4 average with $5,200-$5,300 peak potential, Deutsche Bank $4,450 annual average, Bank of America $4,538. Realistic expert consensus $5,000 based on central bank buying and Fed policy. Extreme geopolitical scenario targets $6,000+.
What is silver price prediction for 2026?
According to my technical analysis, immediate target $88 (161.8% Fibonacci extension). Robert Kiyosaki forecasts $200 next milestone, previously predicted $500 from $100 within a year. Experts expect silver to outperform gold due to industrial demand growth (AI data centers, solar panels), market deficit, and lower institutional ownership creating catch-up trade potential.
For real-time gold and silver analysis as prices target $5,000 and $88 respectively, follow me on X (Twitter) @ChmielDk. I provide technical breakdowns, Fibonacci projections, institutional forecasts, and trading insights on precious metals and crypto markets.