Bitcoin (BTC) price is falling for the sixth consecutive session, dropping to $89,369 on January 20, 2026, the longest losing streak since November 2024, as Trump's renewed tariff threats and risk-off sentiment triggered a crypto market meltdown.
The flagship cryptocurrency lost over 3.4% intraday, testing lows of $89,162 before recovering slightly, but remains down nearly 7% over six sessions from its recent $98,000 peak.
According to my technical analysis, Bitcoin has once again fallen below both the 50 EMA (at $90,298) and 200 EMA (at $105,731), clearly suggesting a downtrend with immediate targets at $84,000 consolidation lows and extreme downside risk of -40% to $50,000 based on Fibonacci extensions.
The death cross from November 16, 2025, remains an active strong sell signal, while the broken head and shoulders pattern continues to project medium-term targets at $74,000 (April lows) and $61,000 in a more bearish scenario.
Why Bitcoin Is Going Down Today?
Tariff Threats Pull Risk Assets Lower
"The tariff baton has been swung once again overnight and pulled all risk assets lower with European equities trading almost 2% down," explains Paul Howard, Direcot at Wincent. "We have seen cryptocurrencies largely follow this trend and can expect that to continue once the US opens for business today. Volatility is back."
Bitcoin's current price of $89,369 represents a 3.44% decline from yesterday's close of $92,559, with the cryptocurrency testing a day low of $89,162, the weakest level in two weeks. Over six consecutive declining sessions, Bitcoin has lost nearly $9,000 from its January 17 peak near $98,000.
- This New Bitcoin Price Prediction Shows BTC May Fall 25% Below $70,000
- Bitcoin Price Prediction 2026: Can BTC Hit $225K or Will Fall to $75K?
- Why Crypto Is Going Down Today? Bitcoin, XRP Price, Ethereum and Dogecoin Moves Under Death Cross
"The global dip off the back of renewed tariff threats is what has driven the sell off in the majors including Bitcoin," Howard notes. President Trump's escalating Greenland acquisition threats, including 10% tariffs on eight European nations (escalating to 25% by June), have triggered widespread risk-off sentiment across global markets.
Despite $1.4 billion in Bitcoin ETF inflows last week, the cryptocurrency continues crashing. "This ran in the face of the $1.4 billion inflows BTC ETFs saw last week and indicates breaking $100,000 is going to be far more macro-led than previous rallies," Howard explains.
"The key factors on BTC moving higher will be US policy driven so I expect until we see conditions improve (lower interest rates) and less tariff rhetoric. As a result, BTC is likely to stay below the $100,000 level for the time-being."
Bitcoin Technical Analysis: Death Cross, Below 50 and 200 EMA
Bitcoin prices are falling for the sixth consecutive session, which is the longest such losing streak since November 2024. The strongest declines are observed today when Bitcoin loses over 3.4% and tested the level of just $89,162. At the time of writing, the cryptocurrency is slightly bouncing and Bitcoin changes hands at $89,369, but this doesn't change the fact that over the last 6 sessions it has lost nearly 9% in total and dropped to the lowest levels in two weeks.
According to my technical analysis, the cryptocurrency has once again fallen below 50 EMA (currently at $90,298) and remains far below 200 EMA (at $105,731), which clearly suggests a downtrend. Prices reversed after last week's approach to nearly $98,000 and are now returning to the range of consolidation drawn since November, whose lower limit falls at the level of $84,000.
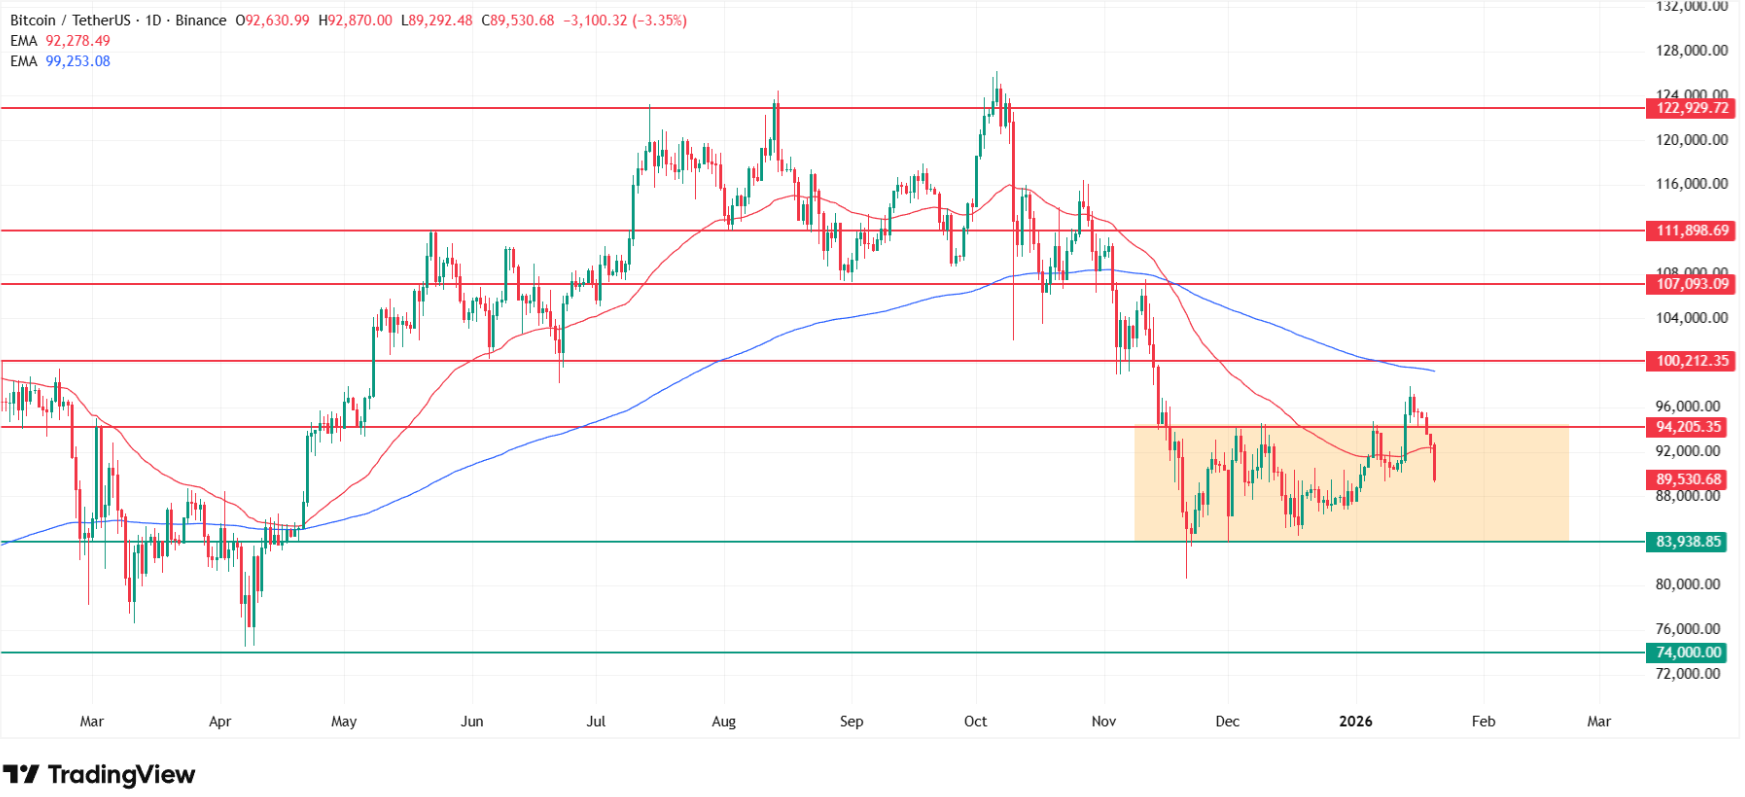
As I show on my chart, I remind about the death cross drawn on November 16, 2025, which still remains an active strong sell signal. The 50-day moving average remains below the 200-day moving average, a bearish configuration that historically precedes extended declines.
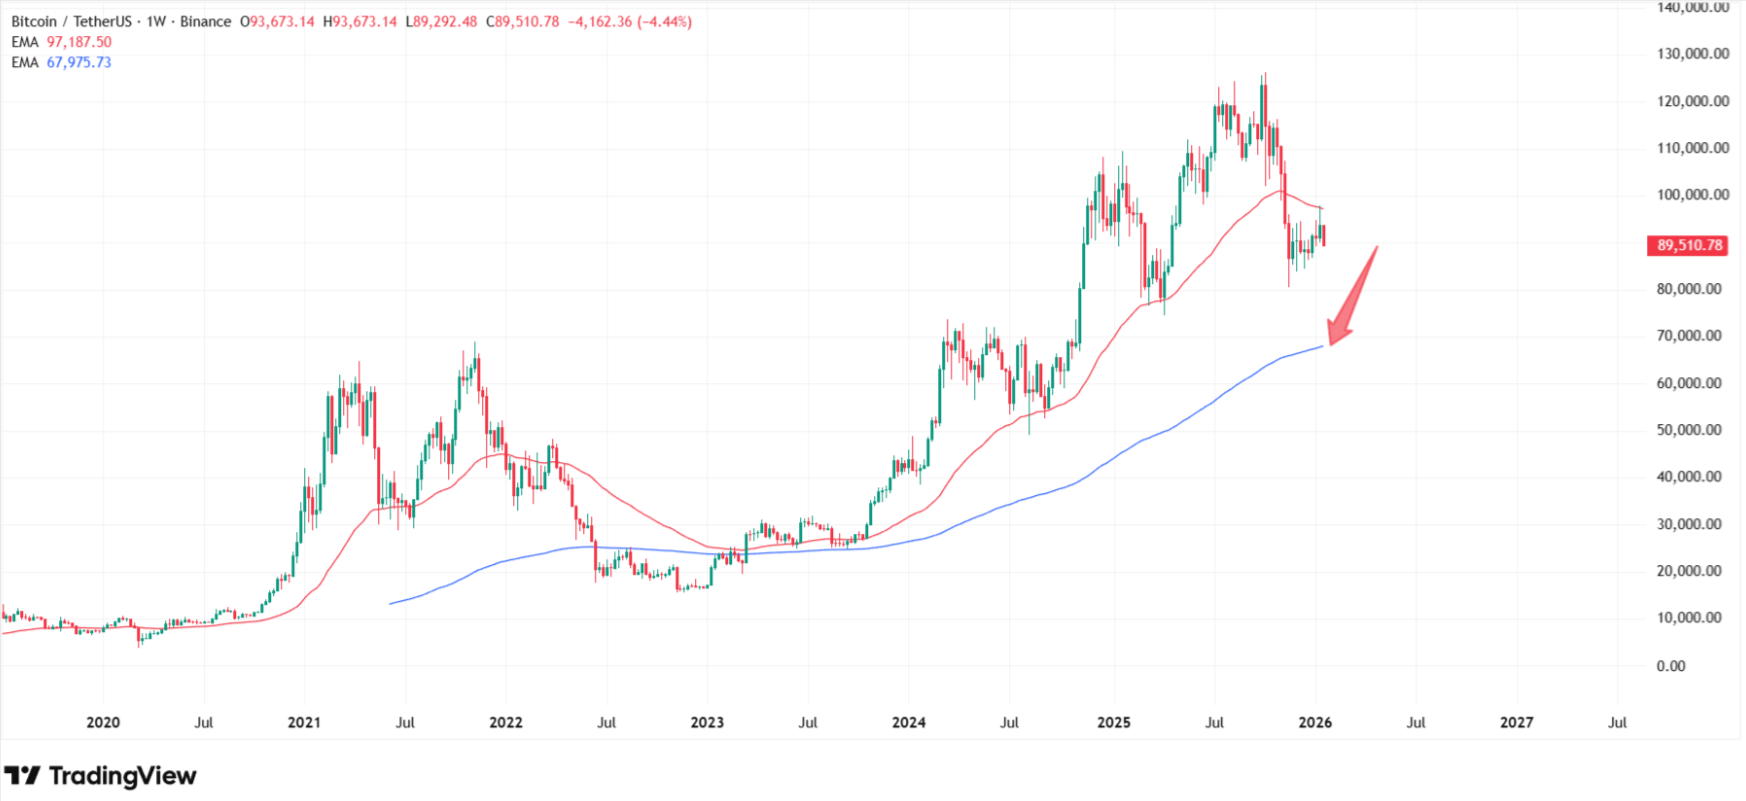
Not to mention the head and shoulders formation broken the same month. I still maintain my medium-term downside target for Bitcoin around $74,000 (April 2025 lows, matching the year low of $74,420), and in a more bearish scenario, I expect declines to $68,000, as mentioned in my weekly moving average chart analysis.
For real-time Bitcoin technical analysis as price tests $84K consolidation with -40% risk to $50K, follow me on X (Twitter) @ChmielDk. I provide death cross updates, Fibonacci projections, and macro impact insights on crypto markets.
Key Bitcoin Technical Levels
- Current price: $89,369 (Jan 20, 2026, sixth straight decline)
- Intraday low: $89,162 (lowest in two weeks)
- Day high: $92,807 (failed rally attempt)
- Recent peak: ~$98,000 (January 17, 2026 - down 8.8% since)
- Losing streak: 6 sessions (longest since November 2024)
- 50 EMA: $90,298 (price below - bearish signal)
- 200 EMA: $105,731 (price 15.5% below - confirms downtrend)
Arkadiusz Jóźwiak, crypto analyst and trader from Comparic.pl, warns: "What we're seeing currently on Bitcoin 's chart, or what we've seen since the beginning of 2026, was only a correction in a bear trend. Current declines are a continuation of precisely this trend."
How Low Can Bitcoin Go? -40% Crash Risk to $50,000
According to my technical analysis, if we base downside considerations on Fibonacci extensions, measuring the last downtrend from October to November, then the correction we observed until the peak on January 17, the 100% Fibonacci extension falls only around $50,000—the lowest levels since September 2024.
From current $89,369 levels, this would mean a possible decline of over 44%.
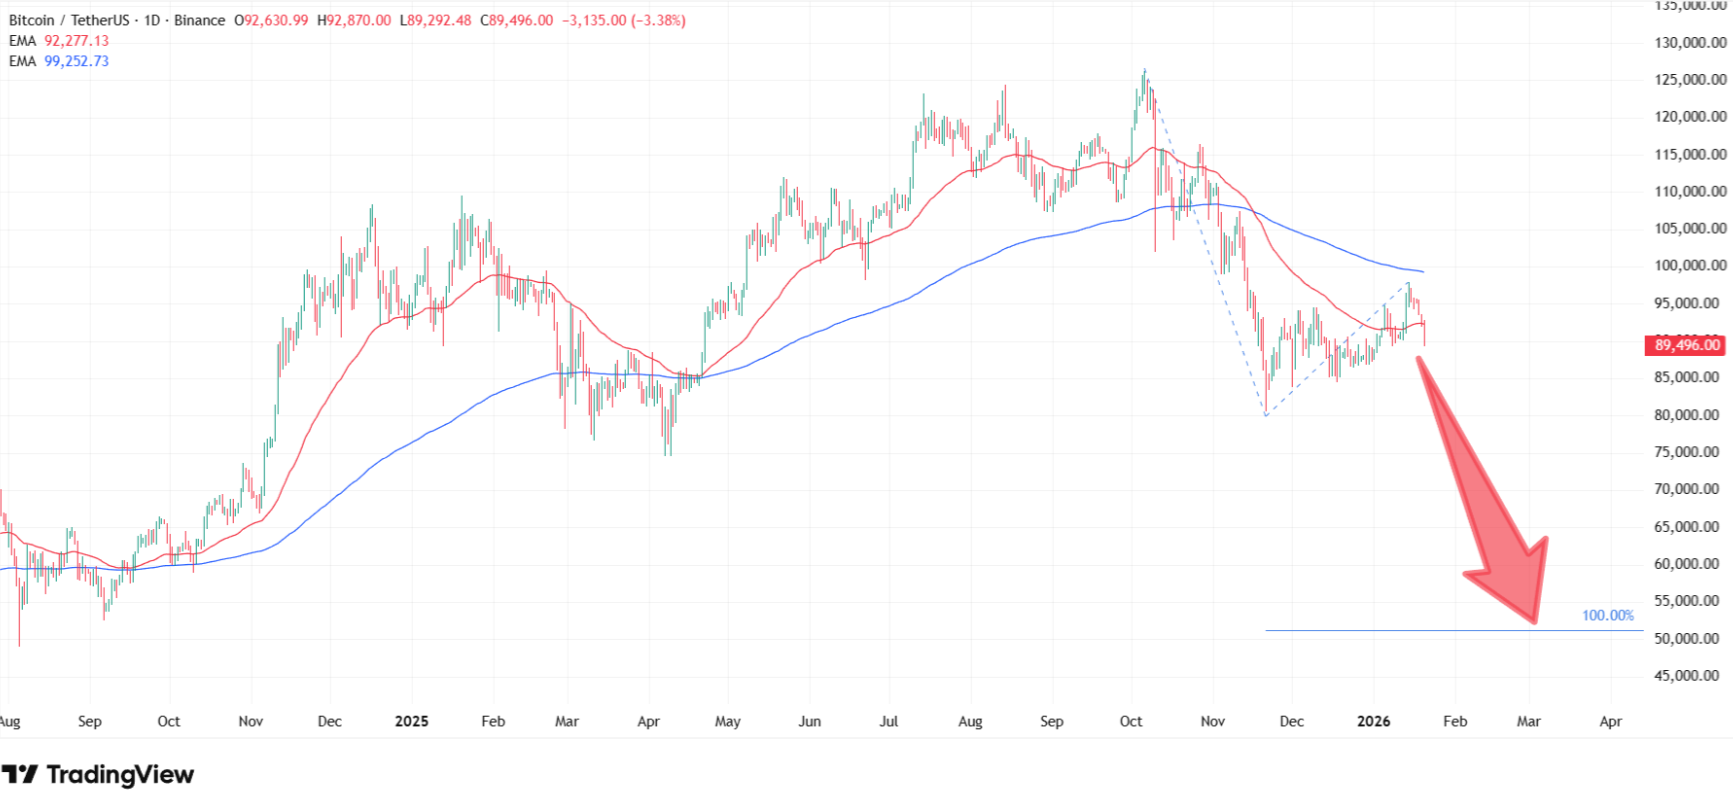
What should happen next with Bitcoin? At this moment, we should head back toward testing the lower band of consolidation. As I show on my chart, the immediate target is $84,000 (November consolidation lower limit, only 6% below current prices).
Bitcoin Downside Targets
Immediate: $84,000
(Consolidation lower band, -6% from current $89,369)
Medium-term: $74,000
(April 2025 lows, head and shoulders target, -17%. Year low sits at $74,420,
very close to this technical target)
Bearish
scenario: $61,000
(Weekly chart analysis, -32%)
Extreme
Fibonacci: $50,000
(100% extension, September 2024 lows, -44% from current)
"What awaits us in the future? At minimum a test of lows from the end of 2025, or going much deeper, to 2025 lows, before weak hands are completely cut out and the market returns to accumulation," Jóźwiak concludes.
The proximity of current prices ($89,369) to the year low ($74,420) is particularly concerning. Bitcoin is only 20% above its 2025-2026 floor, suggesting limited cushion before testing critical support.
Breaking $100K “Far More Macro-Led” – Why $1.4B ETF Inflows Failed
Despite record Bitcoin ETF inflows of $1.4 billion last week, prices continue falling, demonstrating that macro factors now dominate crypto price action. Bitcoin currently trades 10.6% below the psychological $100,000 level at $89,369.
"This ran in the face of the $1.4 billion inflows BTC ETFs saw last week and indicates breaking $100,000 is going to be far more macro-led than previous rallies," explains Howard from Wincent.
Macro headwinds overpowering institutional demand:
- Trump tariff threats on European nations over Greenland (10% rising to 25%)
- European equities down nearly 2% (risk-off spillover)
- Fed independence concerns weighing on risk assets
- Interest rates remaining elevated
- Geopolitical uncertainty creating volatility
"The key factors on BTC moving higher will be US policy driven so I expect until we see conditions improve (lower IRs) and less tariff rhetoric," Howard concludes. "As a result, BTC is likely to stay below the $100,000 level for the time-being."
FAQ: Why Bitcoin Is Falling
Why is Bitcoin falling?
Bitcoin is falling for the sixth consecutive session (longest streak since November 2024), dropping to $89,369 on January 20, 2026, driven by Trump tariff threats on European nations and risk-off sentiment.
Why is Bitcoin going down today?
Bitcoin fell 3.44% to $89,369 (intraday low $89,162) as "the tariff baton has been swung once again overnight and pulled all risk assets lower with European equities trading almost 2% down," explains Paul Howard from Wincent.
How low can Bitcoin go?
According to my technical analysis, immediate target is $84,000 (consolidation lower band, -6%). Medium-term: $74,000 (April lows matching year low $74,420, head and shoulders target, -17%). Bearish scenario: $61,000 (-32%). Extreme Fibonacci extension: $50,000 (100% extension, -44% from current $89,369).
Is Bitcoin in a bear market?
Yes, according to technical indicators. As I show on my chart, Bitcoin trades 15.5% below 200 EMA ($105,731) with death cross active since November 16.
Will Bitcoin break $100,000?
Not in near-term. Bitcoin currently trades at $89,369, 10.6% below $100K. "Breaking $100,000 is going to be far more macro-led than previous rallies," says Howard from Wincent.