$72.88 per ounce. That is where silver changed hands on the morning of April 7, 2026, roughly $49 below the $121.64 all-time high reached on January 29. The white metal has been moving sideways since mid-March, locked in a narrow range with the Easter period producing almost no meaningful volatility . During Tuesday's session, silver rose a modest 0.15%.
The silver price prediction landscape has shifted dramatically since January's record. The Reuters poll of analysts now projects a 2026 average of $79.50 per ounce, up from $50 as recently as October 2025. Yet the most interesting signal is not coming from the price chart at all. It is coming from the physical market, where COMEX registered inventory has fallen to levels that exchange analysts flag as stress territory.
As the February 18 Finance Magnates comprehensive gold and silver price prediction analysis noted, the Silver Institute projects a sixth consecutive annual market deficit in 2026 at approximately 67 million ounces.
This week brings catalysts that may break the stalemate: FOMC minutes on April 8, Q4 GDP with core PCE data on April 9, and the approaching U.S.-imposed deadline on Iran. The Fed holds rates at 3.50-3.75%, and CME Group data shows a 0% probability of an April cut.
Follow me on X for real-time market analysis: @ChmielDk
Why Silver Is Stuck? Iran, the Fed, and the Rate Trap
Silver's 40% decline from the January peak is not a straightforward correction. It is the result of the same paradox that hit gold: an active Middle East conflict that should theoretically support precious metals is instead suppressing them through the monetary policy channel. The closure of the Strait of Hormuz sent crude surging, which fed inflation expectations, pushed Treasury yields to the 4.3-4.4% range, and strengthened the dollar. For a non-yielding metal like silver, all three are headwinds.
Bas Kooijman, CEO and Asset Manager of DHF Capital S.A., confirms that silver prices traded sideways extending a period of consolidation as investors remained cautious ahead of key geopolitical developments. The approaching U.S.-imposed deadline on Iran is heightening uncertainty and discouraging aggressive positioning, he notes. Kooijman adds that recent Federal Reserve remarks further anchor this narrative, with policymakers emphasizing inflation risks over labor market concerns, reinforcing expectations that rates could remain unchanged for longer. Forecasts now largely discard the possibility of rate cuts this year.
- How High Can Silver Go? Silver Price Predictions Target $300 in 2026
- Why Silver Is Falling? XAG/USD Price Drops Below $84 After 13% Two-Day Collapse
- Why Silver Price Is Going Up Today? XAG/USD Breaks $91 Key Level, Gold Doesn't Follow
Despite these headwinds, the broader structural backdrop remains constructive. Kooijman points out that the silver market is expected to post a sixth consecutive annual supply deficit. Attention now turns to the release of the FOMC minutes and key inflation indicators, he notes, adding that the data could be crucial in determining the direction of silver prices.
The U.S. economy added 178,000 jobs in March, the strongest nonfarm payroll gain in over a year. As the March 20 Finance Magnates analysis of why silver was crashing documented, the hawkish Fed hold in March, which revised 2026 dot-plot projections down to just one cut, hit silver harder than gold. The white metal had rallied from $40 to $121 in roughly fourteen months almost entirely on dovish Fed expectations and dollar weakness, making it acutely vulnerable to a policy repricing.
The March 17 Finance Magnates analysis of gold and silver falling together established the amplification pattern: silver dropped nearly 20% from its weekly high while gold fell 6% over the same two sessions. Silver amplifies gold in both directions.
COMEX Inventory Tightness: The Bullish Signal Price Is Ignoring
While the silver price has been declining, the physical delivery data has moved in the opposite direction. According to BloFin Research, COMEX registered silver inventory, the metal carrying warehouse warrants that is immediately available for delivery, stood at approximately 76 million ounces as of late March 2026. Against total silver futures open interest of approximately 576 million ounces, that implies a coverage ratio of just 13.4%.
A coverage ratio below 15% is the threshold that exchange analysts historically associate with delivery stress. The current reading sits just below that level.
The March 2026 delivery cycle was unusually large: approximately 9,212 contracts equal to roughly 46.1 million ounces of physical silver. That figure represents approximately 60.6% of the entire current registered stock absorbed in a single delivery month. The registered inventory drawdown has been accelerating since late 2025.
Technical Analysis of the Silver Price Chart
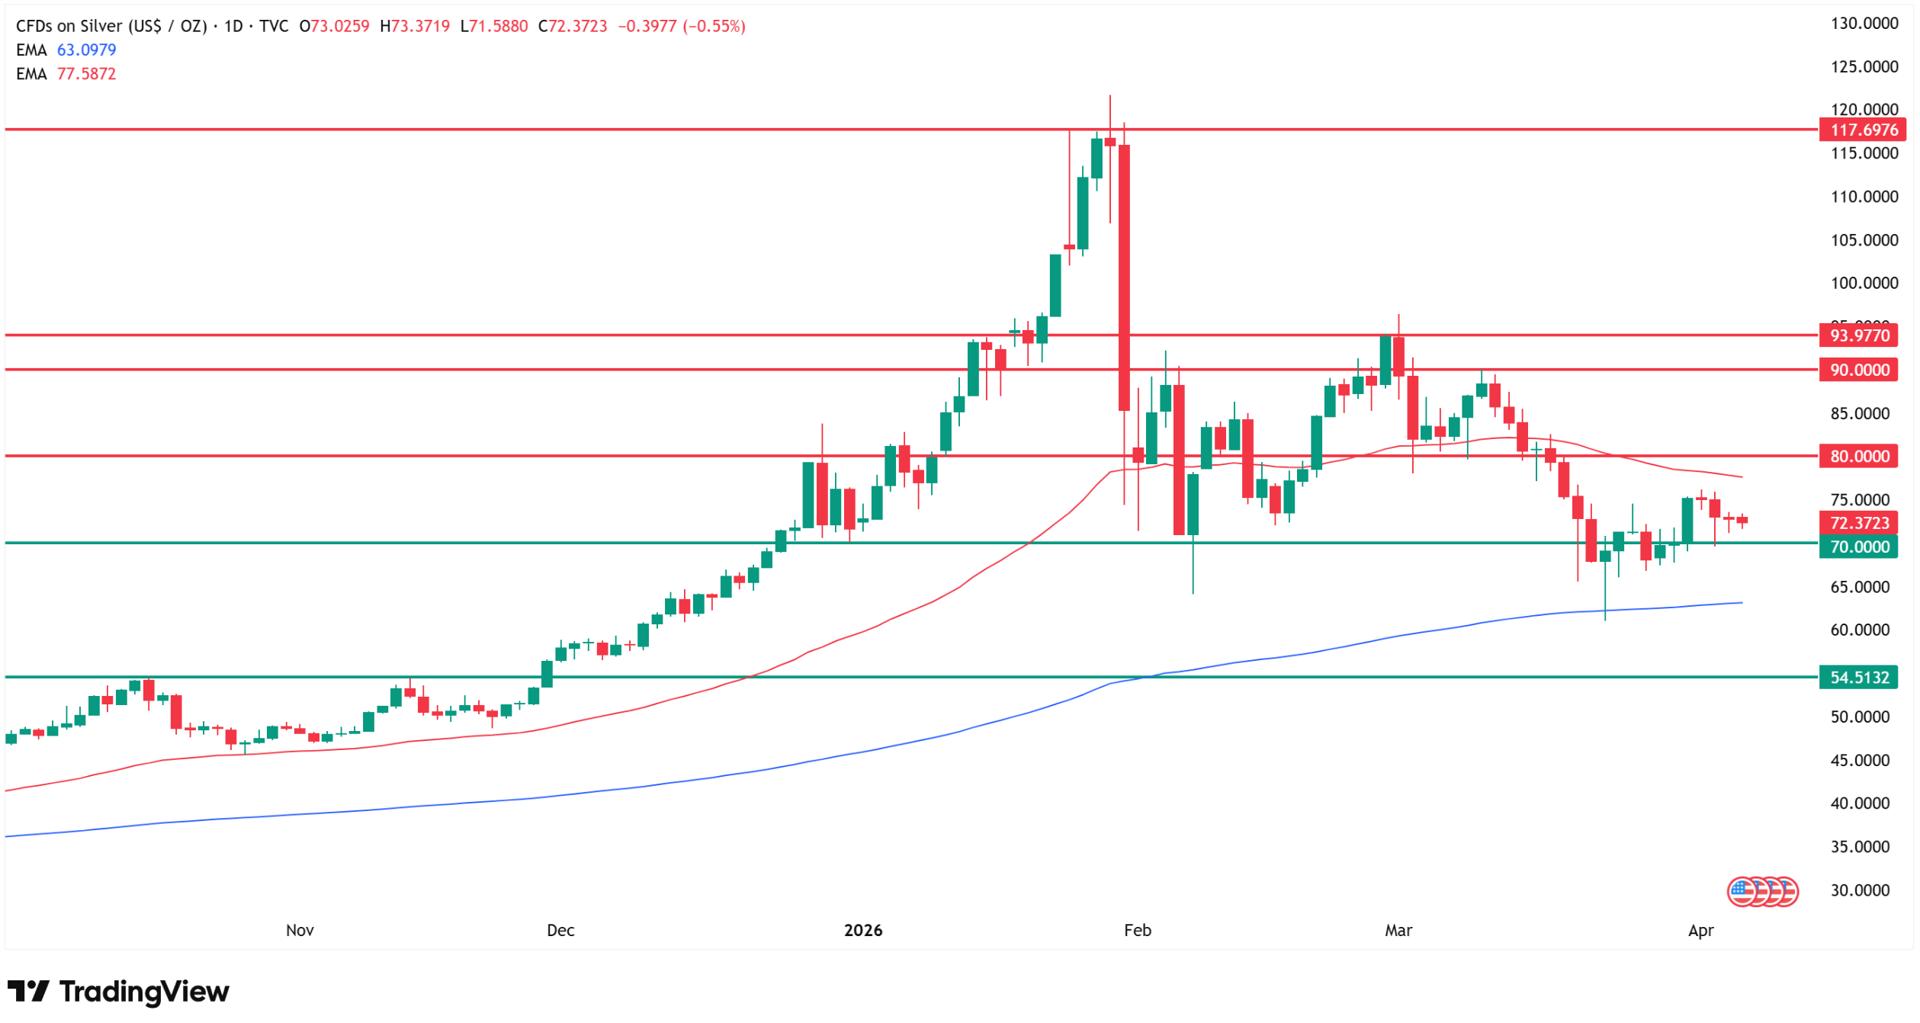
Based on my over 15 years of experience as an analyst and trader, the silver chart on April 7, 2026, shows a market trapped within two overlapping consolidation structures that together define the range to watch.
My chart shows the first consolidation is bounded by the key moving averages. The 50 EMA, marked in red on my chart, is acting as resistance near $78 per ounce. The 200 MA, marked in blue, provides the slower structural support near $63. This level was tested on March 23 and rejected by price, but the upper band at the 50 EMA has not yet been broken either. The space between these two averages defines the primary technical battleground.
The second channel is defined by local price action. The upper boundary sits at the early March highs near $94 per ounce. The lower boundary runs through the round $70 level. Between March 19 and March 30, price attempted to break below $70 repeatedly, balancing above and below this level across multiple sessions. Ultimately, $70 held and the breakdown proved false. As the March 20 Finance Magnates silver crash analysis confirmed, $70 has now held for the third time since the start of 2026.
Together with the moving averages, these channels create a combined structure that defines the current setup.
Level | Type | Notes |
$121.64 | All-time high | January 29 intraday peak |
$94 | Resistance (local highs) | Early March peaks, upper channel boundary |
$78 | 50 EMA resistance | Red line on my chart, current battle zone |
$72.88 | Current price | April 7, 2026 |
$70 | Support (round level) | Lower channel boundary, held 3 times in 2026 |
$63 | 200 MA support | Blue line on my chart, structural floor |
$54 | Bear case target | October 2025 high, downside on channel break |
My directional bias is neutral within the range but fundamentally constructive. The technicals alone say: wait for a break. If silver exits these channels to the downside, breaking below $63 and the 200 MA on a sustained basis, the path opens toward $54, the October 2025 high. That level represents the next major structural support below the current consolidation.
If silver breaks to the upside, clearing the 50 EMA near $78 and then the $94 local highs, the path reopens toward the $120 zone tested in late January. As the February 10 Finance Magnates analysis of Bank of America's $309 silver prediction documented, my previous Fibonacci targets above $100 remain valid for the broader cycle but require a clean breakout above $94 to reactivate.
The COMEX physical data, however, tilts the probability toward the upside resolution. A 13.4% coverage ratio and a 12-13% SHFE premium are not typical of a market about to break lower.
Silver Price Prediction 2026: What Analysts Are Targeting?
The range of silver price predictions for 2026 is extraordinarily wide, reflecting both the unprecedented nature of recent price action and genuine analytical disagreement about whether the paper pricing mechanism can continue to diverge from physical fundamentals.
The Reuters poll now projects a 2026 average silver price of $79.50 per ounce, as the February 18 Finance Magnates silver and gold forecast established. That same poll projected $50 just in October 2025. The gap between those two numbers mirrors the speed at which the silver market changed.
Bank of America's Michael Widmer maintains one of the most extreme institutional forecasts, projecting silver could reach between $135 and $309 per ounce based on historical gold-to-silver ratio compression. As the February 10 Finance Magnates analysis detailed, the gold-silver ratio currently sits near 64:1. A return to the 2011 extreme of 32:1 would mathematically support silver at roughly $146 per ounce given gold at $4,685. Citigroup's $150 target, published January 29, rests on a similar thesis but with a three-month time horizon that has since expired without being met.
The January 29 Finance Magnates coverage of Citi's forecast noted that Citi called silver "gold on steroids."
At the extreme bull end, macro strategist David Hunter targets $180 for silver, while Robert Kiyosaki's $200 forecast sits alongside Tom Bradshaw's $375 by 2028.
Source | Target | Key Assumption |
Bank of America (Widmer) | $135-$309 | Gold-silver ratio compression to 32:1 |
David Hunter | $180 | Q2 2026 metals breakout |
Citigroup | $150-$170 | Gold-silver ratio + Chinese demand |
GoldSilver (Hibbard) | $175+ | Outperformance vs. 2025 |
Robert Kiyosaki | $200 | Fiat currency crisis thesis |
Reuters poll (analysts) | $79.50 avg | Highest consensus in recent history |
Silver Institute | Deficit continues | 6th consecutive annual deficit, 67M oz |
JPMorgan | $81 avg | Conservative base case |
Bear case (my TA) | $54 | October 2025 high on channel break |
How High Can Silver Go? Bull and Bear Scenarios
The bull case for silver in 2026 rests on the convergence of physical tightness and structural industrial demand. COMEX registered inventory at 13.4% coverage, a persistent 12-13% SHFE premium, and a sixth consecutive annual supply deficit create conditions where a relatively small increase in physical demand could force a significant repricing. As Kooijman from DHF Capital notes, the structural backdrop remains constructive despite near-term headwinds from rates and the dollar.
Industrial demand continues to build. China's silver imports reached 206.76 tonnes in the first two months of 2026, the highest level in eight years, as the February 23 Finance Magnates analysis of silver surging with gold documented. Data centers, EV production, and AI infrastructure are all growing end-uses for the metal. The Silver Institute projects physical investment demand rising 20% in 2026 to 227 million ounces, a three-year high.
If the Fed delivers rate cuts in the second half of 2026, weakening the dollar and compressing real yields, silver's dual identity as both safe-haven and industrial metal positions it for outsized gains. The $94 resistance on my chart is the first gate; a clean break reopens the $120 zone.
The bear case requires continued monetary hawkishness, a strengthening dollar, and resolution of geopolitical tensions that removes the risk premium. If Treasury yields stay above 4% and the Fed holds rates into year-end, silver could struggle to break above the 50 EMA at $78 and eventually test the 200 MA at $63. A sustained break below that level, which has not been tested since March 23, targets $54. That scenario aligns with the broader paper liquidation risk that BloFin Research acknowledges: in a macro risk-off environment, futures prices can continue falling regardless of what physical inventories are doing.
The January 20 Finance Magnates analysis of silver and gold surging together established an important warning: silver showed bubble-like characteristics at the January highs, with Bank of America ranking it highest for bubble-like asset dynamics. Solar panel manufacturers are actively reducing silver content per unit to cut costs, and jewelry demand continues weakening in key Asian markets as high prices squeeze affordability. Those structural offsets cap the most extreme upside forecasts.
FAQ
How high can silver go in 2026?
Silver price predictions for 2026 range from JPMorgan's $81 average to Bank of America's $309 bull case based on gold-silver ratio compression. The Reuters poll projects an average of $79.50 per ounce. Silver's all-time high of $121.64 was reached on January 29, 2026. Extreme outlier forecasts include Robert Kiyosaki's $200 and Tom Bradshaw's $375 by 2028. The bear case on my chart targets $54 if the $63 support breaks.
Why is silver going up in 2026?
Silver's 2026 gains are driven by three forces: physical supply tightness (COMEX registered inventory at 13.4% coverage with a 12-13% SHFE premium), a sixth consecutive annual supply deficit projected at 67 million ounces by the Silver Institute, and industrial demand from data centers, EVs, and solar panels. China's silver imports reached their highest level in eight years in early 2026.
What is the silver price prediction for the rest of 2026?
Reuters projects a $79.50 average, Bank of America targets $135-$309, Citigroup set a $150-$170 target, and macro strategist David Hunter sees $180. On the downside, my technical analysis shows $54 as the bear case target if the $70 support and $63 200-day MA fail. The next key catalysts are FOMC minutes on April 8 and PCE inflation data on April 9.
Why did silver crash from its all-time high?
Silver fell 40% from its $121.64 January 29 peak due to CME margin hikes, hawkish Fed repricing (dot plot revised to one 2026 cut from two), the Iran conflict pushing oil higher and strengthening the dollar, and massive leveraged long liquidation. The crash was amplified by silver's tendency to move roughly 3x gold's percentage moves in both directions.
Is silver a better investment than gold in 2026?
Silver has outperformed gold over the past year with a roughly 150% gain versus gold's approximately 56%. However, silver is significantly more volatile. Silver's industrial demand (solar, EVs, AI infrastructure) provides a growth component that gold lacks, while COMEX physical tightness supports the supply-squeeze thesis. The gold-silver ratio at 64:1 suggests silver remains historically undervalued relative to gold, but the bear case for a 25% decline to $54 is more severe than gold's comparable downside scenario.