The world woke up to a dramatically different geopolitical landscape on Monday, March 2, 2026. Gold surged nearly 2% to test $5,400 per ounce, its highest level since January 30, while Brent crude spiked as much as 13% to $82 per barrel at the open, a 14-month high, as the United States and Israel's coordinated military strikes on Iran triggered the effective closure of the Strait of Hormuz, through which roughly 20% of the world's daily oil supply passes.
The death of Supreme Leader Ayatollah Ali Khamenei on the opening day of the offensive, combined with Iran's retaliatory missile strikes across the Gulf, sent investors flooding into safe-haven assets in one of the most dramatic Monday market openings in years.
In this article, I examine why gold price is going up alongside with oil, analyzing XAU/USD and WTI technical charts.
Follow me on X for more gold and oil market analysis: @ChmielDk
What Happened: Khamenei Killed, Hormuz Shut
The strikes began on Saturday, February 28, when President Donald Trump announced in a video posted on Truth Social that the United States had launched coordinated military operations against Iran alongside Israel. The scale was extraordinary:
- The Israeli Air Force struck over 500 military targets in western and central Iran using approximately 200 fighter jets, the largest combat sortie in its history
- The US military deployed B-2 stealth bombers to strike fortified ballistic missile facilities
- Over 1,200 bombs were deployed in the first 24 hours
- US and European officials stated three core demands: permanent end to uranium enrichment, strict limits on Iran's ballistic missile programme, and a complete halt to support for proxy groups
The consequences were immediate and historic. Supreme Leader Ayatollah Ali Khamenei was killed on the opening day of the offensive. Iran retaliated with dozens of drones and ballistic missiles targeting US military bases across Jordan, Kuwait, Bahrain, Qatar, Iraq, Saudi Arabia, and the UAE.
Iranian ballistic missiles struck Dubai, with footage showing an impact at a five-star hotel on Palm Jumeirah, a city that has become one of the world's most important hubs for CFD brokers and financial trading firms.
By Sunday the conflict had escalated on multiple fronts. Hezbollah declared an "official declaration of war", launching projectiles from Lebanon toward Haifa and Upper Galilee, while the Yemen-based Houthis announced the resumption of Red Sea attacks. Iran's response in the Strait of Hormuz may prove the most consequential act for global markets: Tehran warned all vessels that no ships would be permitted to transit the waterway, and tanker tracking data showed traffic through the strait's main shipping lanes halted completely on March 1.
- At least 100 oil tankers stopped near UAE and Oman coastlines
- Two ships were attacked in the strait
- The Houthis' Red Sea resumption effectively shut a second critical maritime corridor simultaneously
CFD brokers and prop firms raised margin requirements and leverage limits even before markets opened, bracing for the volatility that followed.
Why Gold Price Is Surging? XAU/USD Tests $5,400
The flow of investors toward safe havens in the face of what happened over the weekend is, according to my analysis, a completely natural market reaction. Gold opened Monday nearly 2% higher, reaching $5,368-$5,390 per ounce, its highest level since January 30, 2026, with US gold futures surging 2.58% to $5,382.60.
In Indian markets MCX gold jumped 3.5%, while silver surged simultaneously, with spot silver rising 1.68% to $95.35 per ounce, testing late January levels. By the time of writing, silver's gains were reduced to +0.3% at $94, while gold held its advance more firmly near $5,362.
- Why Gold Is Falling with Silver and Why ANZ Forecasts $5.8K Price
- Fortex Links Kilo Gold to XAU/USD as Bullion Price Tests Record Highs for the 50th Time in 2025
- Why Gold Is Surging? Gold Price Climbs Today for 5th Session, Touches ATH
From the perspective of my technical analysis, gold is now just a short distance from a very important resistance zone. $5,430 is where price closed at the end of January on the weekly chart, and I would expect a stronger accumulation of sell orders there. However, current geopolitical tensions may meaningfully shift the balance of forces, and this is not a normal technical setup.
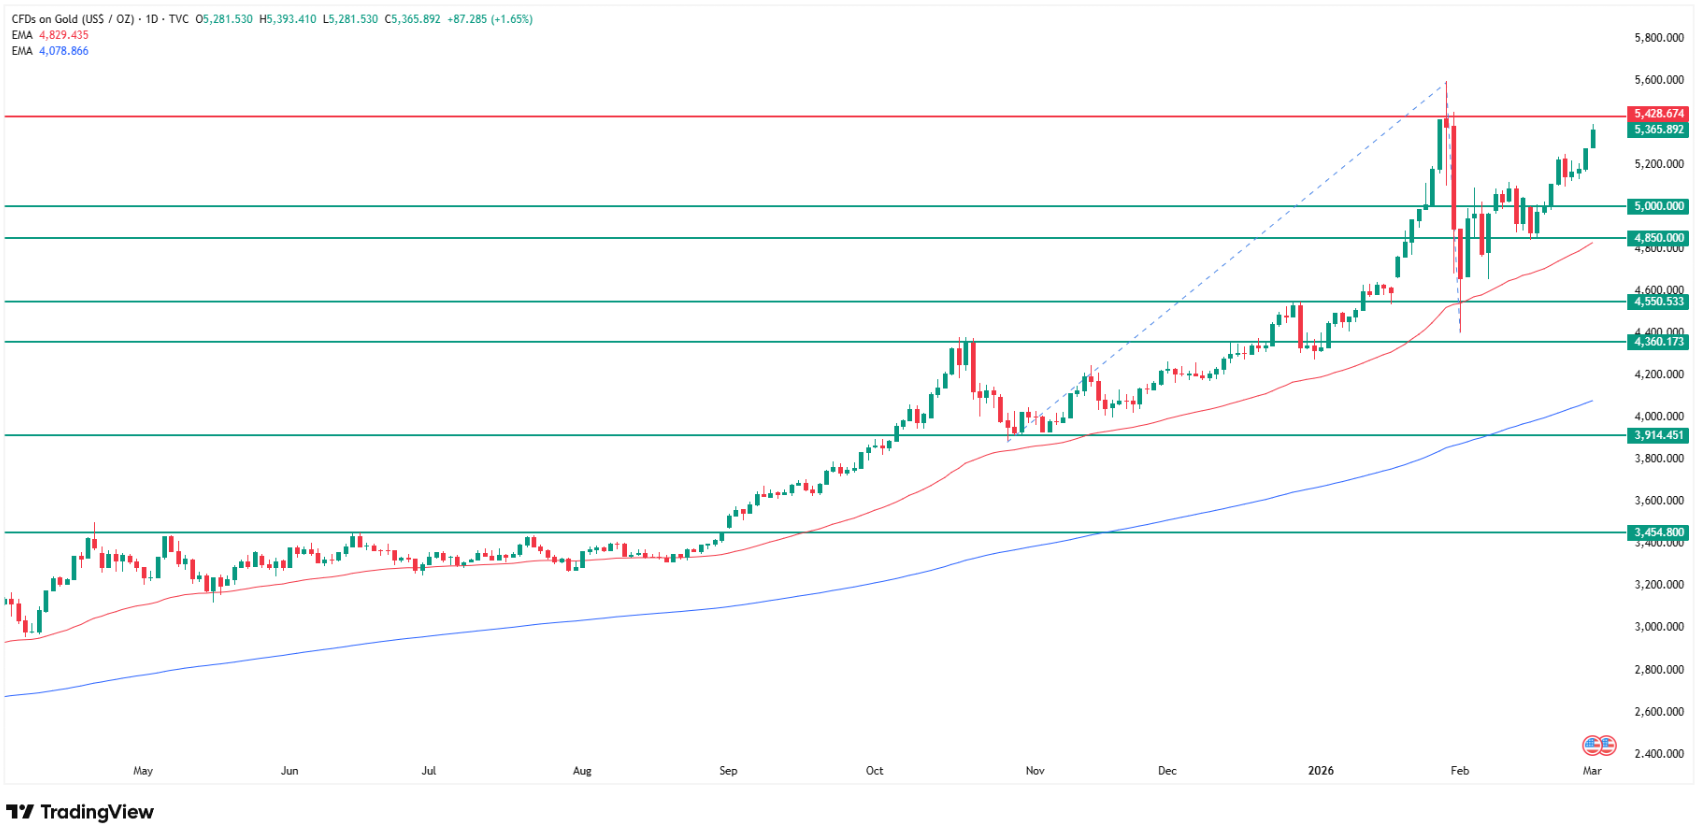
The bigger picture from my analysis is compelling: from the February lows, gold has now recovered over 20%, and at current levels around $5,362 we are already just a few percentage points from the all-time highs at $5,600. If $5,430 breaks decisively, the path to retesting the January 28 high at $5,415 and the January 29 record at $5,600 opens fully.
The longer-term Fibonacci projections pointing to $6,100-$7,200, which I outlined earlier this year, would then become the primary reference targets. On the downside, according to my analysis gold has strong supports: the $5,000 psychological level and then $4,850, where the 50 EMA creates a double support floor.
Level | Type | Significance |
$5,600 | All-time high (Jan 29) | Target if $5,430 breaks |
$5,430 | Key resistance | Author's critical pivot |
$5,362-5,390 | Monday open range | +20% from Feb lows |
$5,000 | Major support | Psychological round number |
$4,850 | Strong support | Confluence with 50 EMA |
Dilin Wu, Research Strategist at Pepperstone, captures the near-term uncertainty precisely: "XAUUSD opened approximately 1.4% higher on Monday following the sudden escalation of tensions in the Middle East, but buying pressure proved limited thereafter. With the path of the regional conflict remaining highly uncertain, short-term gold volatility has increased significantly."
Why Oil Is Surging 13%? Strait of Hormuz Is the Story
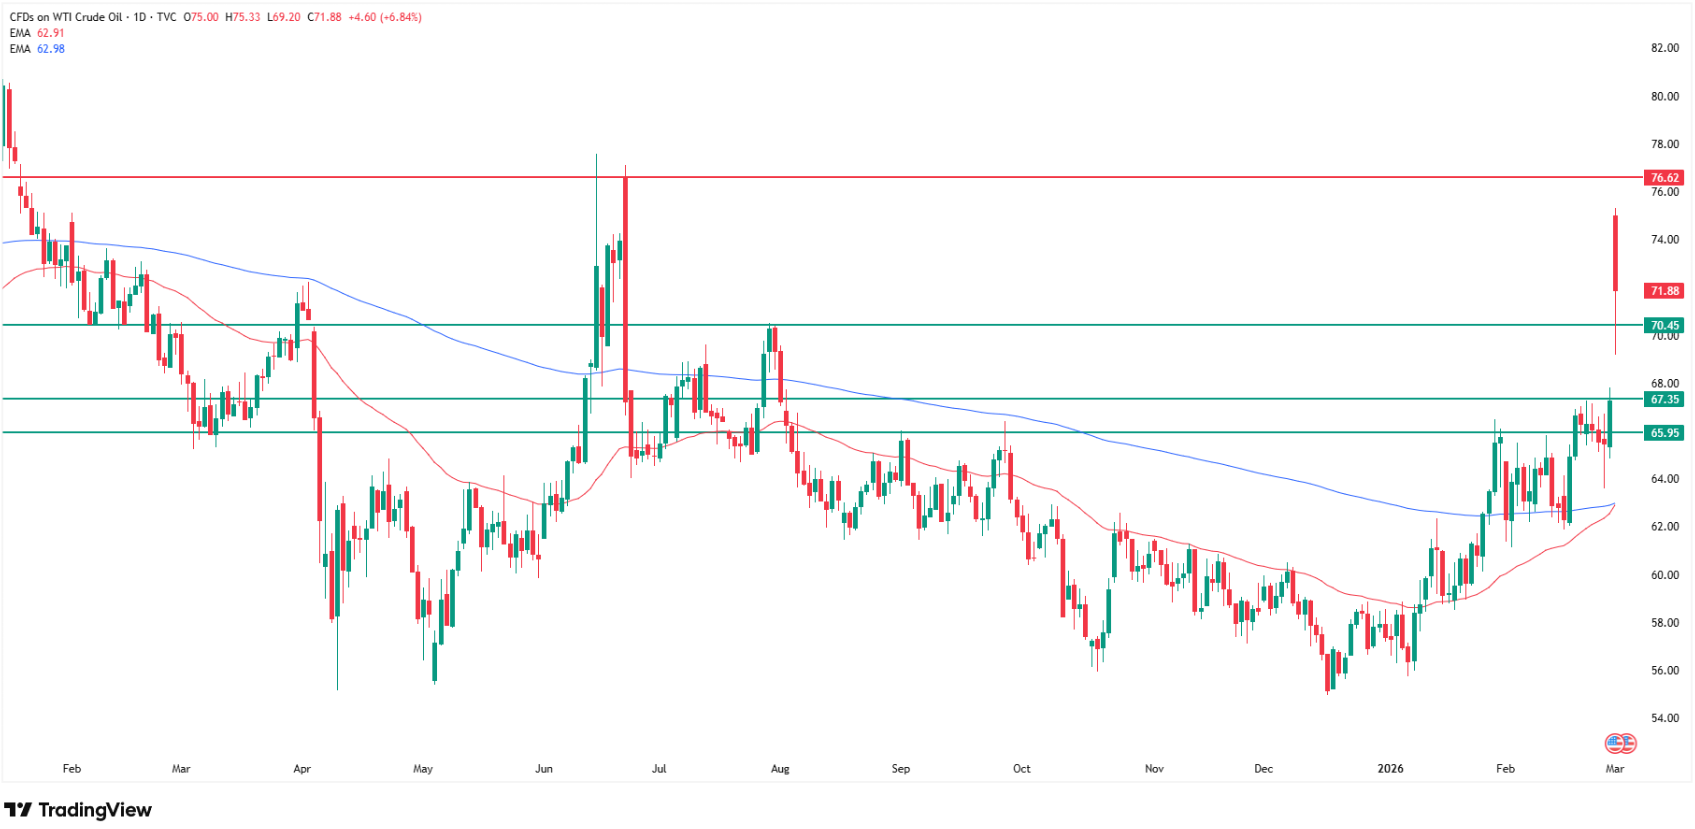
The oil market's reaction was even more dramatic. At Monday's open, Brent crude surged 13% to $82 per barrel, a 14-month high, while WTI jumped up to 12% from Friday's close, which had itself been the highest since August 2025. By the time of writing, a significant portion of that move has been digested: WTI is now around $70-72 per barrel (+6.5%), and Brent is holding around +4% in early trading. We remain, however, above last summer's peaks, which now serve as an important support level.
Jeff Mower and S&P Global CERA analysts identified the core mechanism: "Oil tanker traffic transiting the main shipping lanes in the Strait of Hormuz was halted on March 1. Even if production and terminals remain intact, higher risk premiums, ship owner caution, and delayed shipping fixtures can reduce delivered barrels, supporting higher risk premiums on March 2 opening until maritime threats de-escalate."
The Strait of Hormuz handles approximately 20% of the world's daily oil trade and 20% of global LNG. Its closure, even partial or temporary, represents a supply shock with no quick fix. Key institutional forecasts for oil this week:
Institution | WTI/Brent Forecast | Scenario |
Goldman Sachs | $18/barrel risk premium | Current disruption priced |
Wood Mackenzie | $100+ per barrel | If Hormuz stays closed |
Citi | Brent $80-90 this week | Primary scenario |
Citi | Brent back to $70 | If tensions ease rapidly |
Lipow Oil Associates | 1970s-style shock possible | 33% probability worst case |
Oil Technical Analysis: Golden Cross Approaching
Beyond the immediate war premium, my technical analysis of oil was already flagging a significant structural signal before this weekend.
According to my analysis, the 50 EMA is now approaching the 200 EMA from below, close to completing what technicians call a "golden cross", historically one of the strongest buy signals in any market. The last time these two averages crossed on the oil chart was July 2024, but in the opposite direction. That death cross generated a powerful sell signal that pushed WTI from approximately $80 per barrel all the way down to $55. Now, my analysis shows the same mechanism appearing to reverse direction.
If the golden cross completes, it would provide technical confirmation of a new long-term uptrend in crude, layered on top of the geopolitical supply shock already in play. That said, I want to be explicit: more important than any technical signal will be geopolitics from here.
FAQ
Why is gold going up today, March 2, 2026?
Gold surged nearly 2% to $5,368-$5,390 per ounce on Monday, its highest since January 30, after the US and Israel launched coordinated military strikes on Iran on Saturday, February 28. The death of Supreme Leader Khamenei, Iran's retaliatory strikes across Qatar, UAE, Kuwait, Bahrain and Iraq, the closure of the Strait of Hormuz, and Hezbollah's declaration of war triggered a classic safe-haven flight.
Why is oil surging?
Brent crude jumped 13% to $82 per barrel, a 14-month high, and WTI spiked up to 12% at Monday's open following US-Israeli strikes on Iran that triggered the effective closure of the Strait of Hormuz, through which 20% of global daily oil supply passes. Oil tanker traffic halted completely on March 1, with over 100 tankers stopped near UAE and Oman.
How high can gold go if the Iran war escalates?
From Monday's $5,362-$5,390 level, according to my technical analysis the immediate target is a break above $5,430 resistance, which would open the path to retesting the $5,415 January 28 high and the $5,600 all-time high. A City Index analyst forecasts gold reaching $5,500 and potentially a new record above $5,600. My longer-term Fibonacci projections point to $6,100-$7,200. Key downside supports remain at $5,000 (psychological) and $4,850 (50 EMA confluence).
What is the Strait of Hormuz and why does it matter for oil prices?
The Strait of Hormuz is a narrow waterway between Iran and Oman handling approximately 20% of the world's daily oil trade and 20% of global LNG shipments. Iran's coastline forms the strait's northern edge, giving it the ability to threaten or block transit. With 100+ tankers halted and two ships already attacked, the disruption is real and immediate. Wood Mackenzie warns of $100 oil if closure persists, Goldman Sachs has calculated an $18/barrel real-time risk premium already priced in, and CNBC analysts have raised the possibility of a 1970s-style energy shock if the closure continues.