

- EURUSD 1.15 holds key to the next move
- USD/JPY more at this low than you might think
- Inflation trade – staying power?
--Subscribe to Jamie Saettele's distribution list in order to receive a free report to your inbox several times a week.
--For more analysis and trade setups (including current positions and the ‘watchlist’), visit SB Trade Desk
--Free trading tips
EUR/USD
Weekly

Chart Prepared by Jamie Saettele, CMT
See REAL TIME trader positioning
-The most recent comments noted that “the failed breakout could be bearish but EUR/USD is still in a range (could end up as a triangle or flat from the 2015 low) and levels to pay attention to for support are 1.0872 (year open) and 1.0820 (May and July 2015 lows)…a break above 1.1500 would argue for the flat pattern interpretation into the mid-1.20s.” The low 2 weeks ago was 1.0820, which is also the trendline that extends off of the 1985 and 2000 low. 1.1500 remains range resistance. A break above would set an objective near 1.25.
-For forecasts and 2016 opportunities, check out the DailyFX Trading Guides.
GBP/USD
Weekly
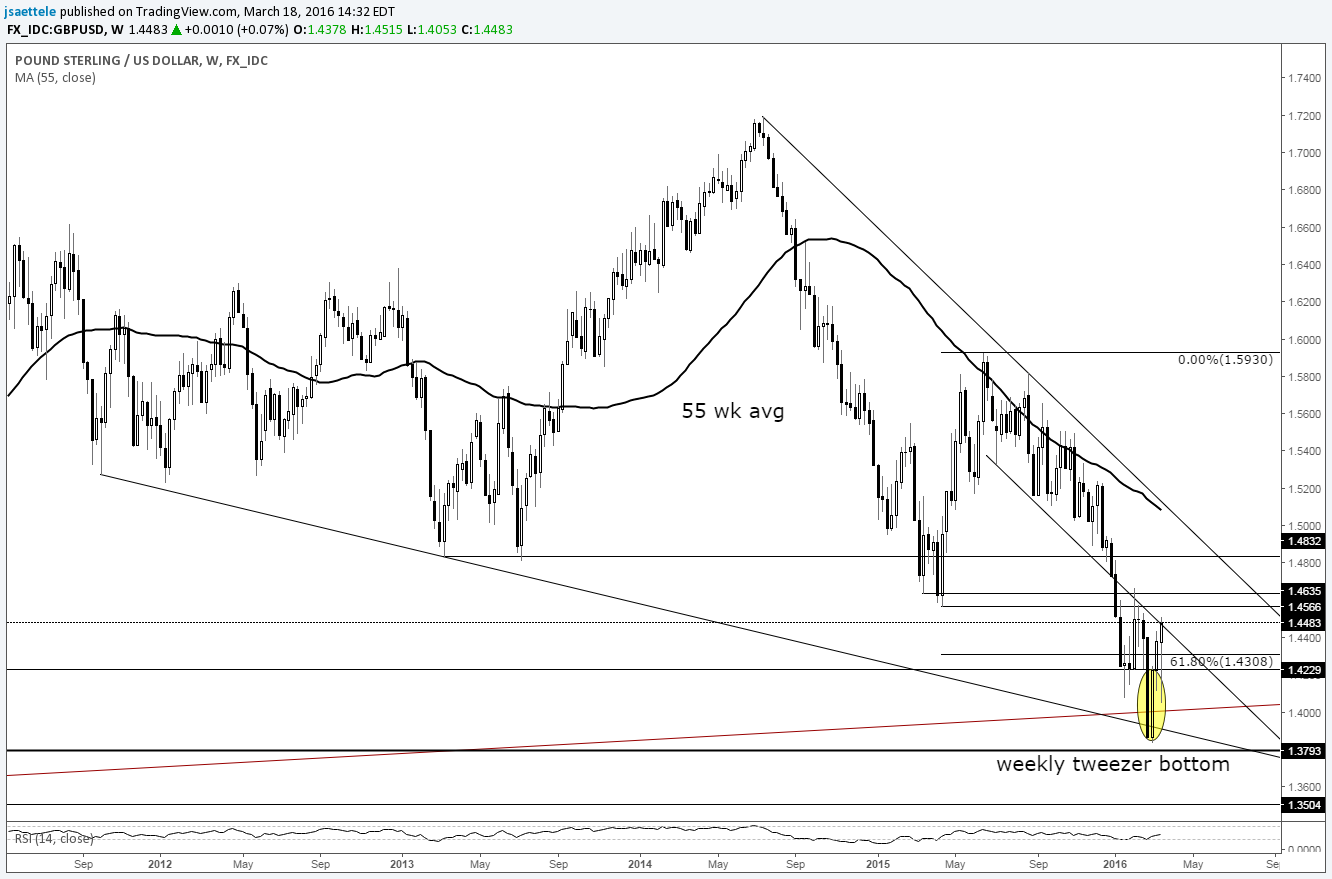
Chart Prepared by Jamie Saettele, CMT
See REAL TIME trader positioning
-There is no change to recent comments regarding GBP/USD. “Close on last week’s low and the low to high move this week leave us with a ‘tweezer bottom’ candlestick formation (FXTW pointed out tweezer bottoms in AUD/USD at the September and January lows). This is a reversal pattern. The fact that the pattern formed amid the chaos of headlines (sentiment extreme on ‘Brexit ’) and at a confluence of trendlines indicates increased risk for a decent sized bounce. General focus is higher, probably until the low 1.50s.”
GBP/USD
Weekly

Chart Prepared by Jamie Saettele, CMT
See REAL TIME trader positioning
AUD/USD
Weekly

Chart Prepared by Jamie Saettele, CMT
See REAL TIME trader positioning
-FXTW has maintained since the start of 2016 that “divergence with RSI on the weekly serves as a bullish reversal warning and that resistance may reside in the mid .7400s.” AUD/USD has pressed into the congestion zone that dominated 2015 so near term trade may take on a more ‘choppy’ tone. Irrespective, focus is higher as per the break above the October and December highs.
-The 2nd week of April is lining up as a potentially important pivot in time. The 1993 and 2001 lows (latter is the all-time low) are exactly 392 weeks apart. 392 weeks from the 2001 low is the week of the October 2008 crash (the low was 3 weeks later). 392 weeks from the October 2008 crash is the week of April 11th. My colleague Kristian Kerr, whose cycle work is a must read, often stresses the importance of what a market is doing into a time window. In other words, a high/low could form if the market is heading into resistance/support within the window (and if other conditions are met of course). Also, a break of a key level during this time would warn of possible acceleration in the same direction. Context is key (always is). For now, just know that the week of April 11th is a big point on the X-Axis for Aussie.
NZD/USD
Weekly

Chart Prepared by Jamie Saettele, CMT
See REAL TIME trader positioning
-FXTW remains conflicted on NZD/USD at the moment and there are no new comments. “Failures shy of the long term median line throughout February were viewed in a bearish light until last week’s outside bullish action lent near term action a more constructive look. The constructive look is maintained as long as above .6565.”
USD/JPY
Weekly

Chart Prepared by Jamie Saettele, CMT
See REAL TIME trader positioning
-The head and shoulders target is still in focus near 105, which is near the January 2014 high and October 2014 low, but it could be a while before that is reached. Don’t overlook the fact that this week’s low is 110.66…or 1 pip from the 2008 high. A parallel to the 1990-1998 line, extended from the 2007 high, is also at the low (this angle was also the neckline from the 2010-2012 inverse head and shoulders that launched the rally into last summer. Generally speaking, USD/JPY could hold up for a while longer.
USD/CAD
Weekly

Chart Prepared by Jamie Saettele, CMT
See REAL TIME trader positioning
-Regarding USD/CAD, FXTW has maintained that “bullish operations may want to hold off until the 55 week average / internal trendline near 1.30 given the break below a 9 month trendline.” 1.30 has been reached so it may be time to go the other way. Weekly RSI has reached 40 as well, which is often associated with at least near term markets lows.
USD/CHF
Weekly

Chart Prepared by Jamie Saettele, CMT
See REAL TIME trader positioning
-USD/CHF is consolidating and there is nothing else to add to previous comments regarding the longer term picture at this time. “Some extremely long term technical considerations are worthy of note when looking at USD/CHF. Read about them here. Levels for possible support on this decline are .9595 (trendline and January 2012 high) and just below .9400 (trendline and 200 week average).”
Bonus Chart
Crude Oil, Copper, and 30 Year Treasury Yield Weekly

Chart Prepared by Jamie Saettele, CMT
-Beginning in early February, FXTW started making bullish cases for crude oil (see here and here), copper (see here and here). Likewise, levels in the Chinese stock market (FXI specifically) have been on the radar. The rallies in these markets indicate a pickup in the inflation trade (in FX…commodity related FX typically performs well during such periods), which is counterintuitive if you listen to the deflationist fighting central banks. These markets are nearing or at resistance levels so be aware of a coming hiccup in the near term. From a bigger picture perspective, action on the long end of the yield curve (influenced more by market forces than bureaucrats) will help determine the staying power of the inflation trade rally. The chart above displays copper, crude oil, and the 30 year Treasury rate. The latter actually made a low that has stood since January 2015. In other words, inflation may be 14 months into a bull market (a positive for commodities), although there could be months or more of basing even if a low is in place before a stronger advance takes place. The highlighted areas on the chart indicate the last several deflationary market events; August 2015 and February 2016. The inflation trade made lows on both events, a telling sign from a trader’s point of view.
Bonus Chart II
30 Year Treasury Bond Monthly
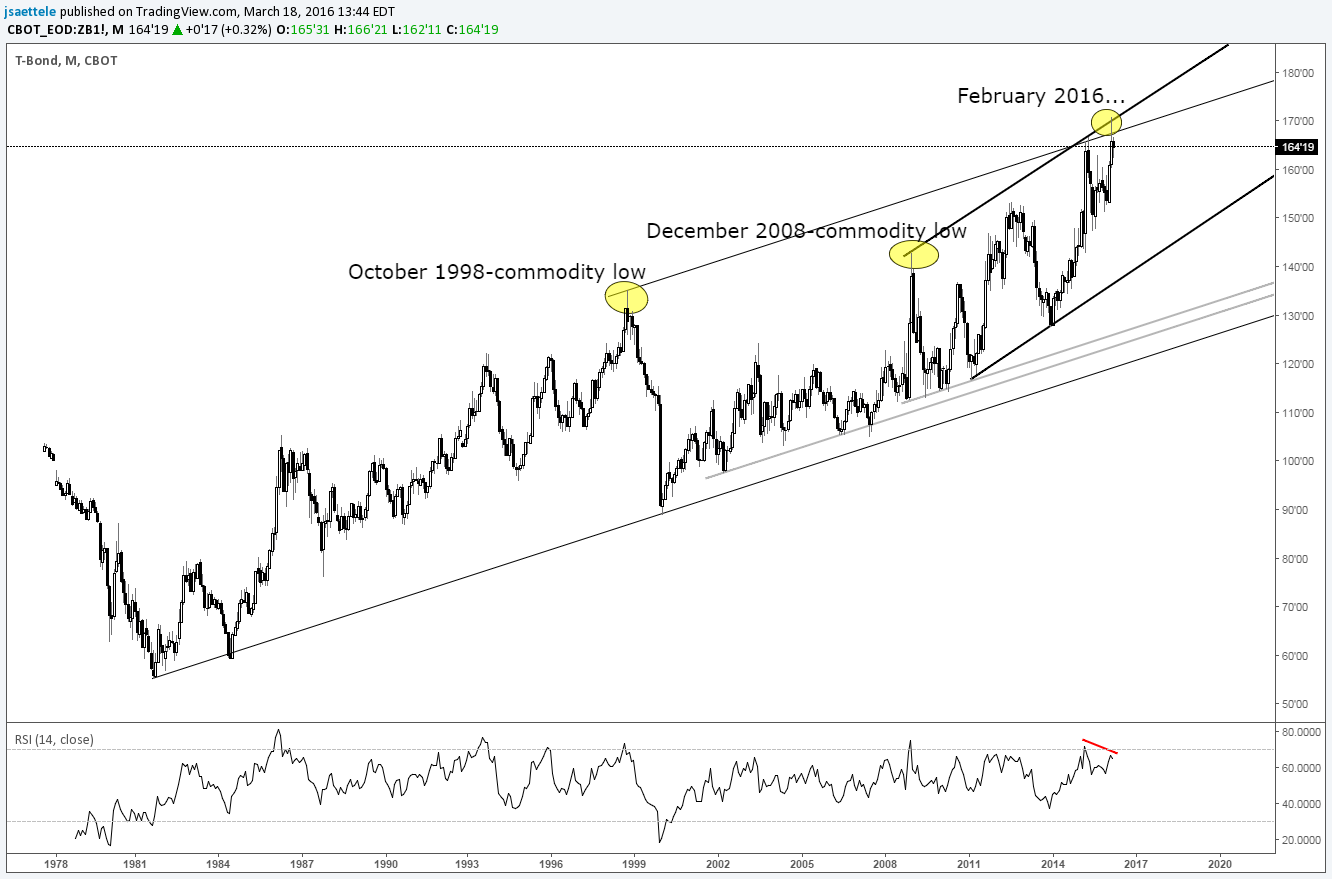
Also, the 30 year Treasury bond (price is inverse to yield) made an all-time high last month at a major channel confluence. One of the channels defines the entire rally from the 1981 low. A trend change on the daily (not shown), which is still constructive, would indicate that the inflation trade is alive and well.
By: Jamie Saettele, CMT, Sr. Technical Strategist


