
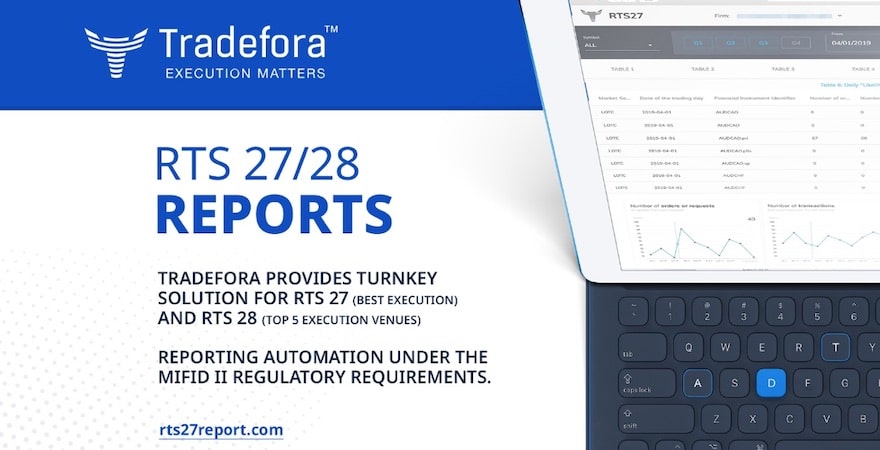
Tradefora PLC, an innovative software company, focusing on solutions for Best Execution, is pleased to announce the launch of upgraded RTS 27 Best Execution Automated Reporting portal 2.0 along with a standalone dedicated website.
This comes as great news for many of Tradefora’s broker-clients. Tradefora’s RTS 27 solution comes fully loaded with built-in features, providing much more than just basic regulatory reporting:
- Fully automated RTS27 report generation
- Daily data updates letting providing insights into the day to day execution quality
- Connectivity to Top 3 bridge providers and API connectivity for proprietary bridges
- Support of MT4, MT5, CTrader and proprietary platform integration toolkit
- 1 year FREE tick data storage plan with DataGuard lookup interface for up to 100 instruments
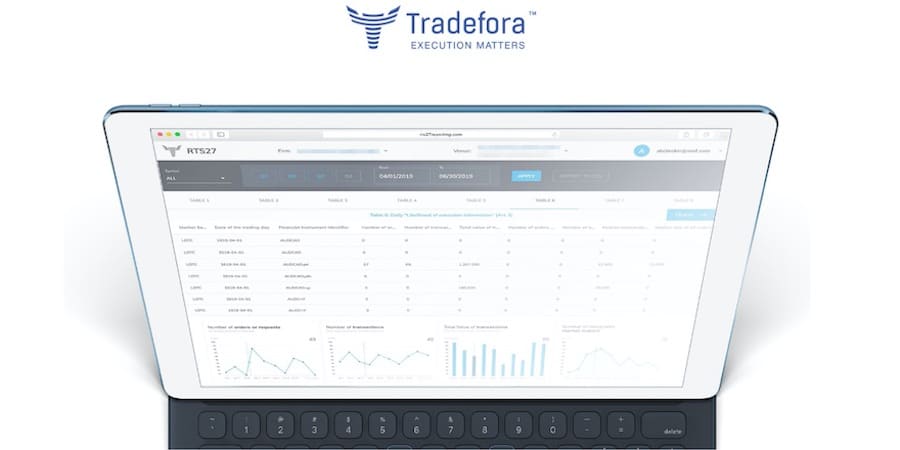
Tradefora RTS27 Reporting Dashboard
In addition, Tradefora’s RTS27 Portal offers a number of value added features, which its users will surely come to enjoy:
- Advanced business intelligence dashboard based on all the key reporting metrics
- Unlimited market data storage plan with a convenient DataGuard query interface
- Tradefora’s proprietary composite index (TCI) as reference price, comprised from peer group price feeds for Best Execution verification
- RTS 28 Top 5 execution venues annual report preparation
Ability to publish reports directly on the https://rts27report.com.

Pavel Khizhnyak, Co-Founder/CEO of Tradefora PLC
“Our Team is very thrilled to see the fruition of intensive R&D work and integrations with bridge providers, broker feeds and Prime of Primes. According to some recently published studies, only 50% of firms obliged to report on RTS 27/28 are actually doing it. And among those who do report, large portion has many serious reporting inconsistencies." explained Pavel Khizhnyak, Co-Founder/CEO of Tradefora PLC.
"Given that both RTS 27 and RTS 28 must be made public, we believe more robust reporting will definitely help all market participants to be more aligned with the Best Execution requirements under the MiFID II directive."
Pavel further commented: “There are 2 main challenges with the RTS 27 report, which push more and broker compliance officers and COOs towards outsourcing this function to professional BestEx companies like Tradefora as opposed to doing it in house, especially after going through their first regulatory checkup."
"In order to be done properly, RTS 27 requires the reporting venue to store the tick data for at least top 3 market depth price increments across all instruments. This means considerable infrastructure investment with constant optimization in order to keep the storage costs in check."
"On top of that, some RTS 27 tables (e.g. Table 3) contain fields, which require reference price data, which in itself is a huge point of contention. So far from what we have observed on the market, many firms opt-in to use Bloomberg or Reuters as the reference price point for RTS27."
However, "we believe that the true reference price should be that of the peer2peer compression and this is exactly the aggregation engine that we have built. Over the last 4 years we developed DataGuard as a highly optimized big data tool to store up to 25 levels of market depth indexable live market data for unlimited number of instruments and Tradefora Composite Index (TCI) as broker peer reference feed, which address both of the 2 key questions and serves as the foundation of what RTS 27 Reporting portal is today. We believe that this is the best approach to measuring Best Execution and is fully aligned with the direction the regulators are going," he added.
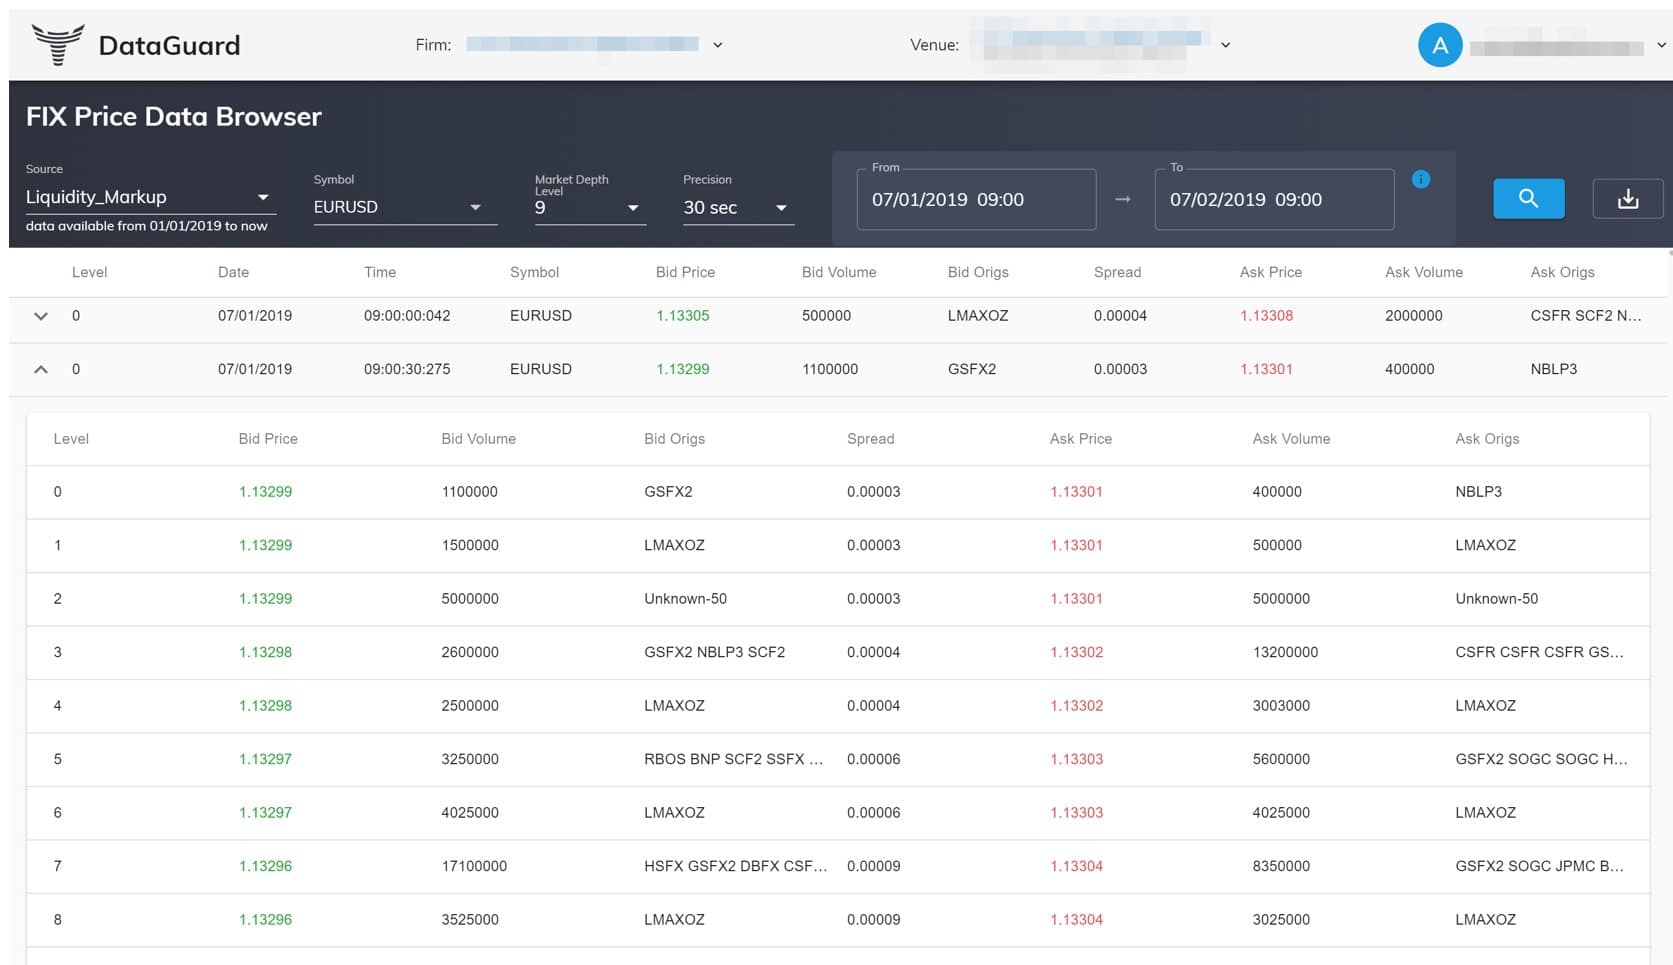
DataGuard – live market data storage, compression and rendering tool
With streamlined onboarding process and a highly experienced team of compliance and reporting automation experts, Tradefora’s RTS27 solution joins the industry ranks as a leading RegTech provider.
Albeit being relatively new to the RegTech space, thanks to its innovative and data driven approach, Tradefora has been already voted as Top 3 Best RegTech Reporting Solution and Top 3 Best Automated Performance Tool at Finance Magnates Summit London 2019.
What is RTS27 Best Execution Reporting?

RTS 27 is an obligatory quarterly reporting for some of the financial market participants (market makers and systematic internalizers) operating in the EU market under the MiFID II requirements, which became obligatory starting January 1st 2018.
The EU’s MiFID II regulations place significant importance on transparency by disclosing pre-trade and post-trade execution quality. Regulatory Technical Standards (aka RTS) articles 27 and 28 deal with best execution requirements.
This reporting must demonstrate that a broker, bank or financial institution that provides trading services is doing so using best bid and best offer approach.
According to the best execution requirements, all of the broker clients’ trades must be executed at best available pricing within the broker’s own price feed and within the acceptable market range of the market benchmark pricing.
RTS27 Report includes 9 tables, with each table showcasing various aspects of the trade execution process. However, unless the reporting venue is using RFQ execution type, only 8 tables are reported.
According to the regulatory requirements, best execution verification must be done 4 times during the trading day (9:30, 11:30, 13:30 and 15:30) with 2 minute snapshots each time.
During these intervals broker must demonstrate that it is quoting and executing its clients within the best prices available on up to 3 price increments of the market depth.
RTS27 Report must be compiled and published by the broker on its website or any publicly accessible repository.
What is RTS28 Report?
RTS28 Report is the annual report for financial firms and investment managers, which focuses on the Liquidity quality and must disclose top 5 execution venues.
It requires investment firms to demonstrate the quality of execution obtained on their Top 5 trading venues.
Going forward for EU market participants it will become increasingly important to demonstrate its aptitude toward providing best execution for their clients under the fast changing regulations.
However, more important will be the ability of such firms to mine vast amounts of data in order to improve their execution quality based on these reports.
Tradefora, therefore, provides a complete solution enabling its broker clients to operate at the peak of their capacity and stay one step ahead on the regulatory curve.
About Tradefora
Tradefora PLC is an innovative independent software provider with focus on Best Execution and a mission to bring about more transparency to the OTC marketspace.
Tradefora has developed a unique set of BestEX and TCA solutions for retail traders, brokers and regulators.
Tradefora Solutions
- TradeGuard – reference price aggregation engine, which works for both historic and live trade BestEx verification for both traders and brokers alike. The retail trader version is the industry’s 1st fully automated TCA and trade execution quality measurement engine, which is offered to all retail traders at no cost and without limits. It is based on aggregating 100+ retail brokers pricing across the most popular instruments (FX, metals, energy and crypto) with powerful visual tools, millisecond precision and trader-specific Analytics . TradeGuard for brokers comes with iframe and json API integration options
- RTS 27/28 – Best Execution Reporting Automation with a dedicated portal ( rts27report.com )
- DataGuard – highly optimized secure solution for tick by tick market data collection, analysis and visualization with up to 25 market depth levels.
- FeedGuard – real-time price feed monitoring, alerts and analytics system for latency, stale pricing and outlier detection.
For RTS 27/28 reporting solutions, please visit – https://RTS27report.com
For all other Best Execution solutions, please visit – https://Tradefora.com
Disclaimer: The content of this article was provided by the company, and does not represent the opinions of Finance Magnates.


