
In our last article on equity curve trading, we looked at the most common form of trading the equity curve, using a rolling average of the account’s equity. Today, we will focus on rolling expectancy ratio, a powerful use of expectancy that can drastically improve your trading strategy.
What is expectancy and why is it important to your trading?
Expectancy is the ratio of reward (or amount you stand to gain) per dollar of risk. Another way to say it is how much you make or lose (on average) per dollar amount risked. We will use a 30 trade rolling expectancy ratio for this analysis. Later, I will tell you why a rolling statistic works better than using all of the trading data. Here is the formula:
((AvgWin / AvgLoss) * WinRate) - (1 – WinRate)
In this formula, we will first normalize the equity curve, removing the trade’s size from the analysis. This allows traders to adjust their trade size depending on whether the current value is above or below their chosen threshold.
30 trade rolling expectancy ratio example
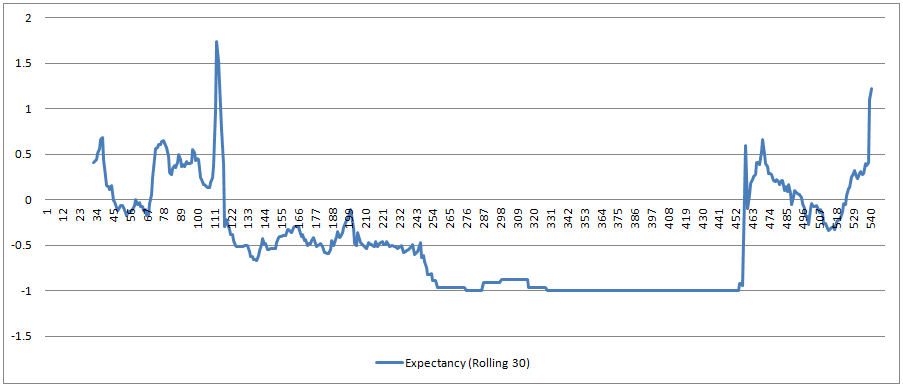
Daticks Rolling Expectancy Ratio
As you can see by the chart above, this trader went through quite a bad string of losses which led to an expectancy ratio of below zero for much of the history.
Now, let’s look at the performance numbers for this trader (past performance is not necessarily indicative of future results). In the table below, the first row shows the trader’s actual return, maximum drawdown (MaxDD) and his DaScore*. The rows that follow show the performance above each expectancy ratio threshold.
For example, the row showing the expectancy ratio of 0 with return of 23.43% is showing all performance when the ratio is greater than or equal to 0 (including all trades from the warm-up period – first 30 trades). What does expectancy above 0 mean anyway? It means that on average you expect to make money on your next trade.
| Expectancy Ratio | Return | Change | MaxDD | Change | DaScore | Change |
| Actual | 14.63% | 0.00% | 31.24% | 0.00% | 0.23 | 0.00% |
| -0.5 | 26.17% | 78.80% | 19.71% | 58.50% | 0.66 | 183.39% |
| 0 | 23.43% | 60.07% | 12.20% | 156.07% | 0.96 | 309.88% |
| 0.5 | 7.22% | -50.66% | 7.62% | 309.97% | 0.47 | 102.27% |
| 1 | 12.45% | -14.93% | 4.48% | 597.32% | 1.39 | 493.24% |
| 1.5 | 11.94% | -18.42% | 4.48% | 597.32% | 1.33 | 468.89% |
In looking at the data above, does using a rolling expectancy ratio help the trader? The answer is a resounding yes! Even the threshold values that show a lower return show a significantly lower drawdown.
Why do the higher threshold values showing lower returns? It could be due to mean reverting tendencies of most trading strategies and investments. Nothing goes up forever and when any metric is at or near an extreme, especially a rolling metric, many times it reverts back to the mean (or average).
Using expectancy ratio to improve trading performance
So how does this actually help you? Well, one way would be to only trade if you “expect” to make money on your next trade. This sounds too basic and obvious, but you would be surprised how many traders do not have a
method for turning their trading strategies on and off with something like this.
When above 0, I trade my way. When below 0, turn off completely, or trade the smallest size available.
I believe that having a specific metric or statistical method for knowing when to turn on and off a trading strategy is one of the most important things for future success in trading.
Another way traders use this is with position sizing. If the expectancy is above/below zero, or another threshold, trade larger or smaller. So they trade larger volumes when the expectancy is above zero and trade the small volumes when it is below. Others may use this analysis to completely turn off a trading strategy if the value ever falls below zero.
Using rolling expectancy instead of using all of the data
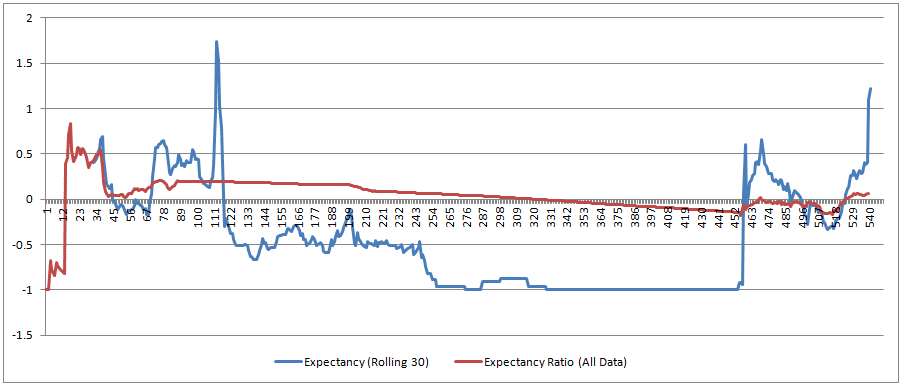
Some traders will suggest using all of the available trading data when doing this type of scenario analysis. My problem with using all of the data is how slow the ratio reacts to changes in your trading strategy’s performance. As you can see in the chart below, the red line, which uses all of the data, reacts much more slowly compared to the blue line, which uses the rolling 30 trades. You can also see there are times where the blue line (rolling 30) is showing a negative value while the red line (all data) is still positive.
Think of the rolling window as how your strategy is performing now, and the all data plot is the overall performance.
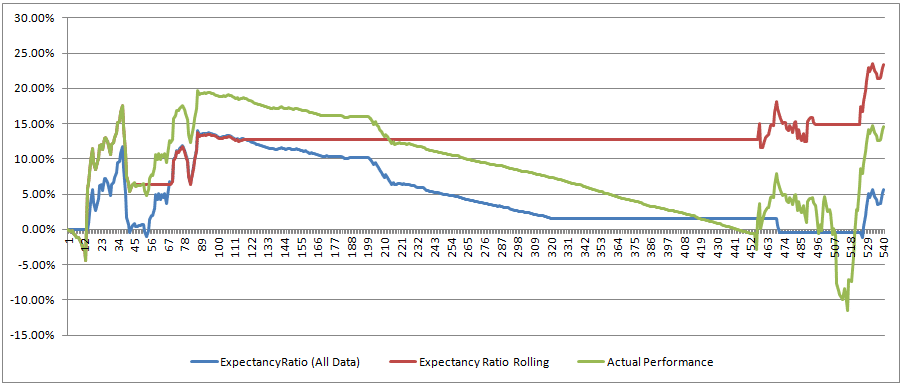
The last chart I will show is a comparison of the equity curves of the rolling expectancy scenario (rolling 30 trades), the all data expectancy scenario, and the actual performance of this trader (not using any expectancy scenarios). Both of the expectancy scenarios are using a threshold of 0. As you can see below, the rolling ratio reacts much more quickly to changes in the performance of this strategy, and it shuts the trading off well before (200 trades before) the all data ratio.
Initially the green line (actual performance) was looking good, but as soon as it started underperforming, the rolling 30 expectancy scenario turned the strategy off before the major losses. You could say this scenario “locked in” trading profits.
How to Tell When This Will Work
Similar to the previous article on equity curve trading, there are pitfalls to avoid when trading (as well as backtesting) this type of scenario analysis. To avoid just fitting the analysis to the data, it is important to look at the full analysis before choosing one threshold to follow. If, for example, the 0.5 threshold is the only positive threshold, I would never follow this particular scenario because there is not an exploitable pattern in my trading history.
However, if all of the thresholds show positive return values, and similar or improving maximum drawdown values, I would be very confident in choosing one of the thresholds. Most likely, I would incorporate the 0 threshold to my trading strategy as a way to know when to turn my strategy on/off. When above 0, I trade my way. When below 0, turn off completely, or trade the smallest size available.
Using the rolling expectancy ratio as a metric to turn a strategy on/off, or determine volume size, can be a powerful addition to your trading strategy. The nice thing is that you don’t have to change anything in your actual entry or exit rules. Just follow the rolling ratio and adjust if it falls below the threshold of your choice.
Happy Trading!
* DaScore = (Return / Abs(2* Max Drawdown)