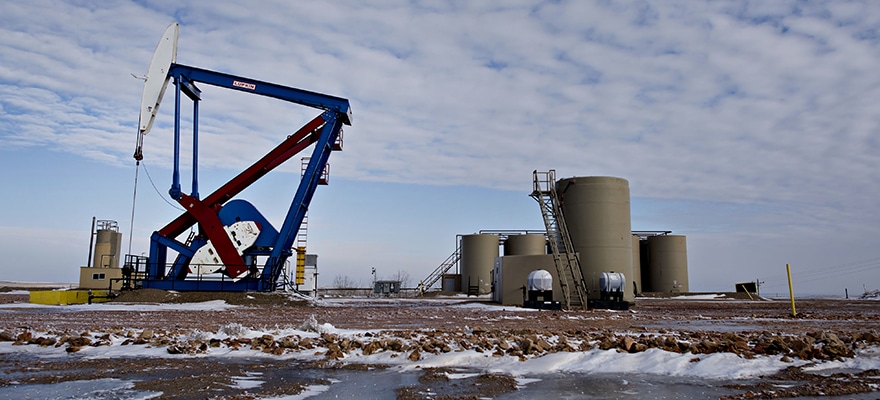
It’s not news to anyone that crude oil is is one of the most difficult markets to analyze and invest in nowadays, especially if the goal is the medium to long term.
After reaching a maximum of just over $107 in June 2014, the crude oil price has initiated a sharp fall to a minimum of $26 in February 11, 2016, largely because of a big oversupply, combined with a succession of news, even nowadays, about the discovery of new marketable reserves.
However, from February 11 to March 18, the crude oil price WTI rose a respectable 58% in the futures market, without there having been any real changes in the supply-demand balance. For the millionth time, market’s behaviour was based purely on expectations. First there were the rig counts in the USA, monitored under the microscope, followed by rumors and news of possible agreements between producers (OPEC and non-OPEC) to freeze production.
One must admit that, at a first glance, expectations seemed credible. If a country like Saudi Arabia, which has always refused to implement measures to stabilize prices, arguing that it was the responsibility of the free market, began to show signs of flexibility regarding an agreement and, at the same time, started to sell crown jewels (privatization of Saudi Aramco), after last year telling the market that it would make a respectable debt issuance (the first since 2007) to cover a huge budget deficit caused by cheap oil prices, then definitely something significant would actually happen.
Definitely ? Not really ! There are still other variables to this equation.
First, in the US, the rig counts have been lower but oil stocks have always increased, which has proven to be a false argument to justify price increases.
Then, freezing is quite different from cutting. Especially after production has increased (!!) in the weeks leading up to the emergence of rumors and news of a possible deal. Any freeze agreement that may now arise would be celebrated on the same existing huge oversupply in early 2016.
At present conditions, with anemic growth, it seems a cut would be the most effective way to raise prices to a fair level, not just a simple freeze.
Moreover, a freeze agreement is not accepted by Iran, which argues the need to increase its production to pre-sanctions levels. It is not clear how long it will take, as part of its capacity is affected by the long interruption. When all the parties claim that they sign an agreement only upon the condition that all countries participate unanimously, then the prospects do not seem to be the best …
Complicated? Let’s complicate things a bit more…
In the US a respected analyst said that prices can only fall because producers took advantage of the recent shooting up to $40 for opening hedging positions on the futures market. With the argument that they are the ones who best know the oil market, which is supported by the imminent saturation in storage capacity.
To put it another way, the producers, in this case companies in the United States, do not believe the recent rise in prices. On the other hand , the stakes of the major funds and big investors (here called speculators) betting on rising prices, have risen in the past four weeks, accompanied by an not-meaningful variation in open interest.
Who is right?
I don’t have the answer, but I have a hypothesis – reaching saturation in storage capacity will certainly cause prices to fall at first – but this could be the beginning of the much anticipated freeze (although forced) in production in the USA, potentially with dramatic consequences for many producers.
Financial markets in general continuously show us, since the crisis began in 2008, that moves in prices are often disconnected from economic reality, due to huge Liquidity in the financial industry resulting from the implementation of QE by the Federal Reserve, in its search for Yield .
Consequently, financial markets have the ability to move prices outside of economic logic. And many explain this with the ability to anticipate the economy.
Thus, it’s possible that financial markets are anticipating that a disaster in the production-storage equation in the US could be a turning point. Am I wrong?
In the futures commodity market there were some negative events (military conflicts, natural disasters, severe unforeseen events, etc) that marked a positive reversal in the respective price cycle. It happened in oil, coffee and others. This hypothesis still makes sense at this juncture.
That said, what can a small investor do for the medium to long term?
In my opinion, with so many complicated and conflicting variables, the answer seems simple – read the price action through the charts, assess the positioning of the major market players (hedge funds , producers , etc), follow the news and evaluate subsequent market reactions. That is what we try to do in a simple way.
The first chart (monthly candles) suggests a hypothetical formation of a reversal pattern, to be confirmed in about two weeks.
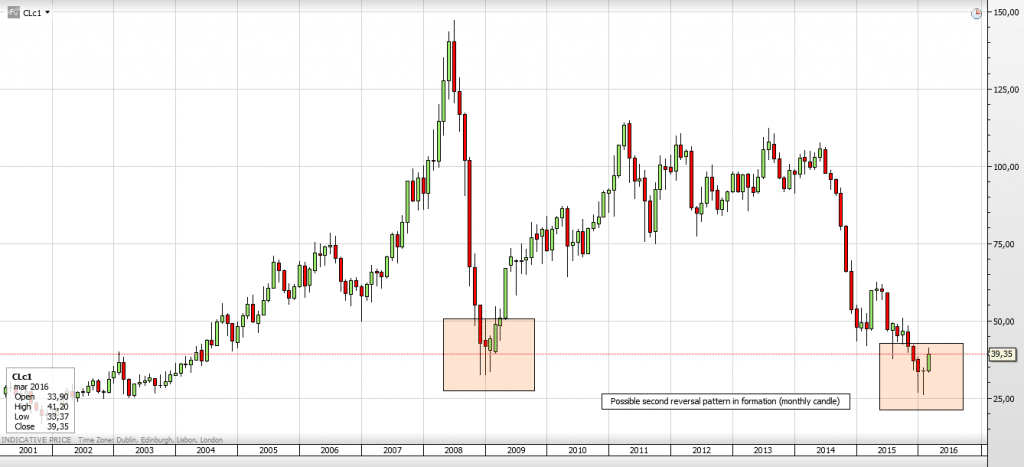
Chart by Saxo Bank, Crude Oil (futures continuous)
The second chart (daily candles) shows a clear double bottom, although short-term in nature, “responsible” for the 58% rise in the prices of the futures market.
As a hypothesis, we may consider this double bottom complete, after having almost performed its price projection and suggesting a potential reversal day on last Friday March 18.
Two significant price levels will be monitored – the maximum on January 28 at around $35 and the minimum on February 11 around $26. If the double bottom hypothesis is confirmed, a first level for correction may be seen at $35.
A second level may be somewhere within the region of $35 and $26, in which prices should be ranging, waiting for clear visibility regarding arrangements between OPEC and non-OPEC producers, or consistently structured on the rise in case of positive outcome.
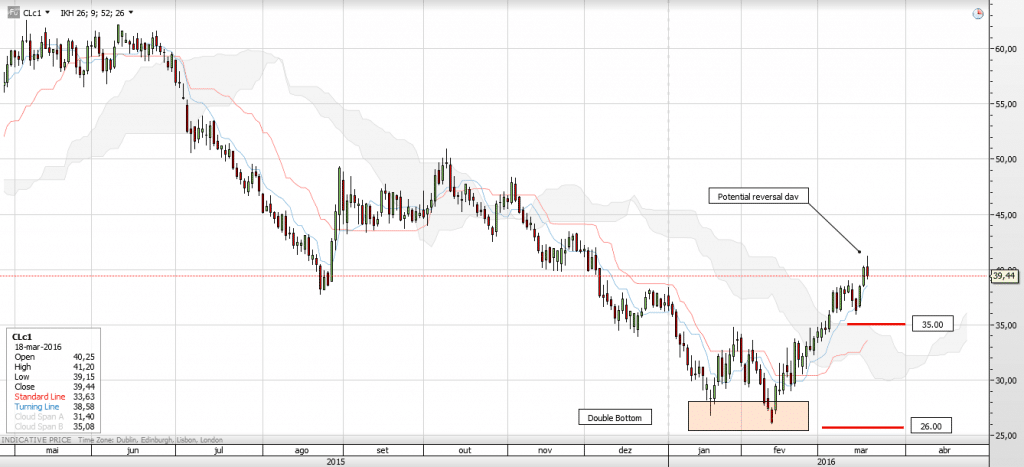
Chart by Saxo Bank, Crude Oil (futures continuous)
Any price action consistently structured on the rise from that above the mentioned region, may be a good entry point for a medium to long term positioning. Something not very usual.
On the other hand, if prices fall below $26 consistently, then we can expect a slam dunk to the famous $20 number. Which could be a disaster with dramatic consequences for many sectors beyond oil!