

This guest blog post is written by Clive Lambert.
ABOUT THE AUTHOR: Clive Lambert, MSTA MCSI is chief technical analyst at FuturesTechs, a UK-based independent technical analysis company covering Equities , bonds, commodities and Forex . FuturesTechs was established in 2000 and was awarded Independent Research House of the Year at the 2014 Technical Analyst Awards. He is a former LIFFE Floor broker and the author of “Candlestick Charts.” You can connect with him on LinkedIn or Twitter.
The S&P and Dow are making headlines by the day for reaching new all-time highs, and the NASDAQ is getting close to the top it reached 15 years ago at the height of the dot-com bubble.
Meanwhile on my side of the pond (I’m based in the UK) the DAX is steaming higher on the promise of QE from the ECB, and the FTSE has made headlines in recent days for touching its historic high, which was set at the end of 1999, never to be bettered… until this week.
Can it continue? What do the charts say? What tools can we use to decide this and help us look out for warning signs of a possible top?
Let’s start 'States-side: Everything I’m looking at below refers to the front-month Futures contracts (currently March ’15).
S&P 500
I use a thing called Volume Profile and this kept me out of trouble in January when the market was chopping around, because we were chopping around either side of a “Volume Node” at 2018. What this means is that throughout the volatile “chop” we saw through January the market kept coming back to this 2018 level. Then February kicked off and one of the first things we saw was a gap higher on February 3rd. What was the gap support? It was 2018.
I put a tentatively bullish note out to clients on that day, saying that as long as 2018 held we might be starting a sustainable push higher, back to the highs. The “tentative” bit has been lessened with each passing day, and now we’re at new highs and beyond. So can it keep going? Well, one thing we use as a gauge as to whether things are getting “carried away” is the RSI Momentum study. Readings over 75 are deemed to be overbought. Over 80 they’re starting to get silly.
Now, this isn’t an excuse to get short, in fact I would never use a momentum study as an “excuse” to bat against a trend, but if you’re worried about a market’s sustainability a high RSI reading may persuade you to take some profit. RSI on the daily chart in the S&P is 64 at present (and on the weekly it’s 61). That’s not overbought. That says we can go higher. Obviously when a market is at all-time highs it’s “Blue Skies” above as far as resistance is concerned.
Arguably there is NO resistance. Actually in the S&P 500 there’s a very nice channel on the weekly time-frame chart that has a top line at 2133 at present, so we may see some profit-taking there. Other than that our next targets to the upside are 2155 and 2181 and there is little evidence on the chart at this time that things are going to turn around. We would need to see a move back below 2100 and 1975 before we need to worry that a retracement of any significance is due. Even then our old friend 2018 might just come to the rescue.
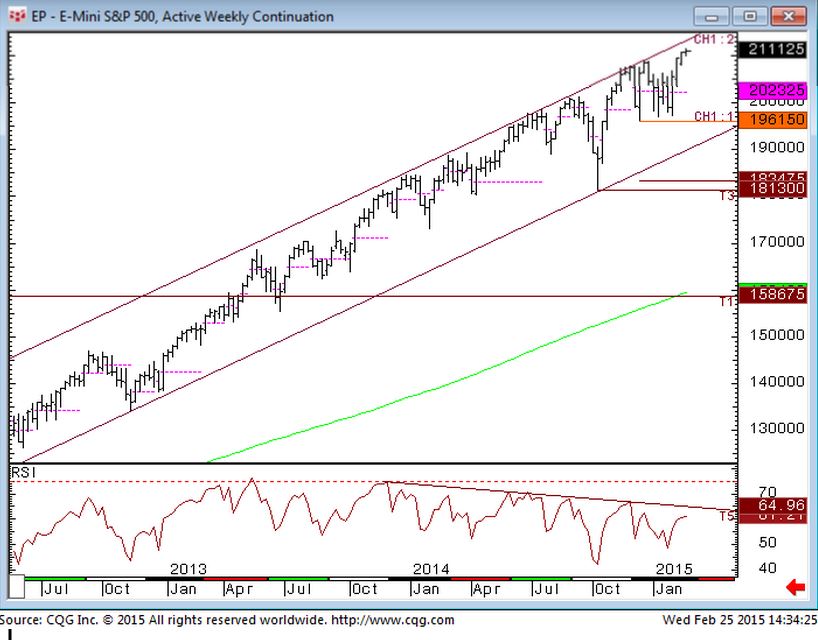
S&P 500 Weekly:
In a rising channel. The highs on the RSI have been moving lower since late 2013, which is a Bearish divergence, but this chart is not giving a firm sell signal.
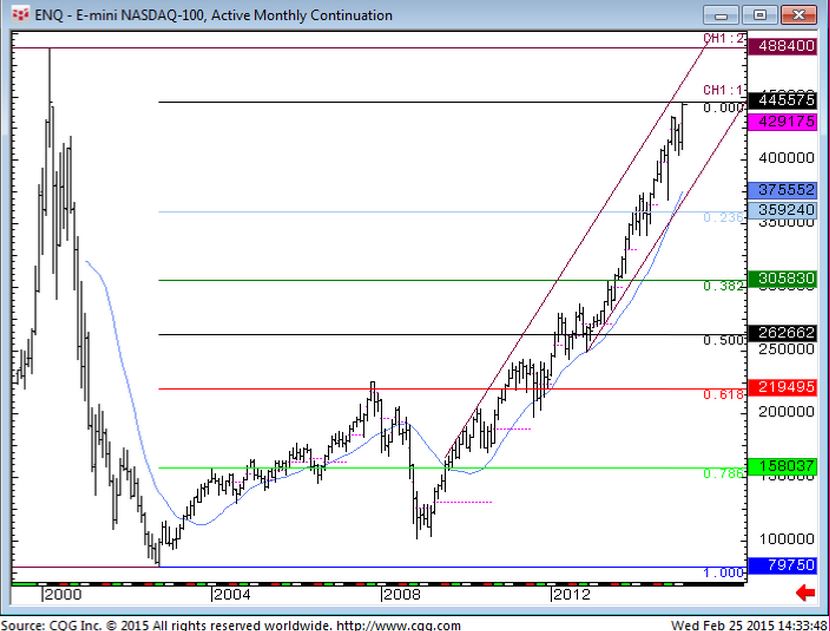
NASDAQ 100 Futures Monthly:
Going up in a straight line again but shy of the 2000 high at 4884.
DAX Futures Daily:
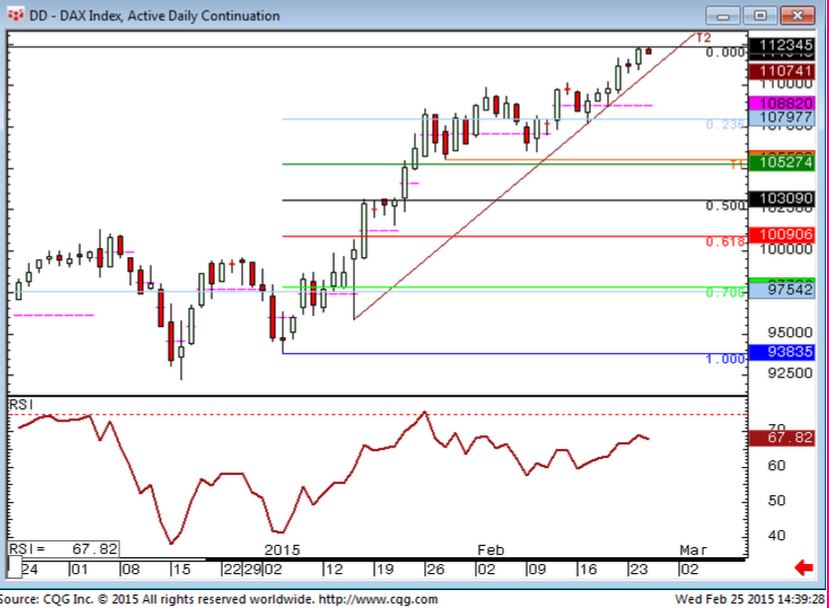
This is the daily chart and shows a market that’s quite happy going higher still. We are at all-time highs so, as per the above, there are blue skies. We have potential resistance above at 11300 and 11360, and 11500 is another upside target using Fibonacci extensions as a guide for potential upside targets. This is the most bullish market I watch at the moment, fuelled, I guess, by the promise of QE from the ECB. We would only start to worry about a top here if support levels like 11050-75, 10765 and 10550 started breaking. There is no sign of this unfolding at present.
Lastly, to the FTSE 100. This is probably the most interesting chart of the lot, as we’re trading at historic resistance that has been persistent. In the last throes of the last millennium we printed 6995 in the futures, reaching a high of 6950 on the “cash” index. Yesterday the “cash” printed 6958. So a new all time high for the “cash” but not quite for the futures. This is illustrated in chart 4, a monthly bar chart:
Monthly Bar chart for FTSE 100 (“Cash”) Index:
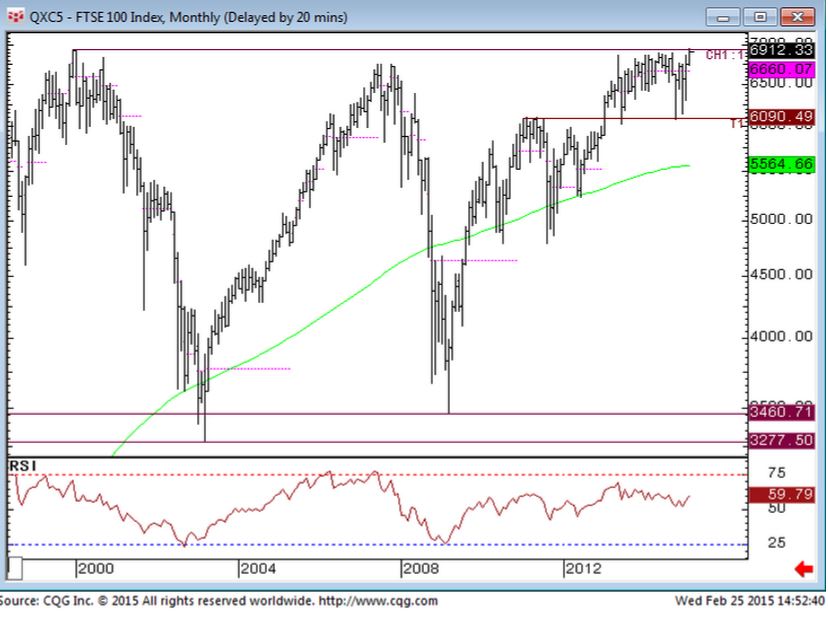
And it’s taken 15 years to achieve this. And we’re not THROUGH here yet. As far as I’m concerned we’re still AT this massive area of resistance. It’s not been put behind us yet.
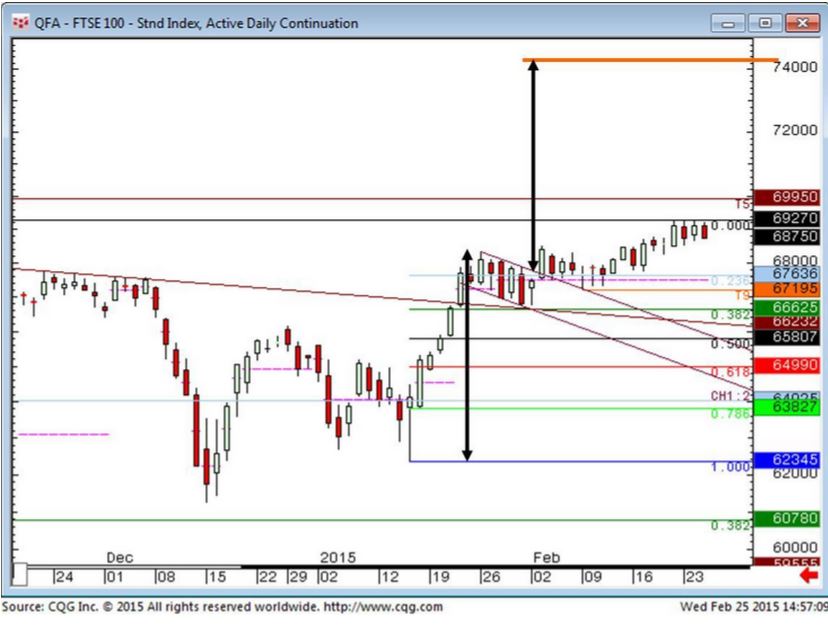
So can we bust through 7000? The daily time-frame chart (Chart 5 below) says “yes.” It says that the last week of January was a “flag” consolidation, and this was resolved to the upside, giving a buy signal on February 3rd. It took a while for this to get going but now we’re gathering steam and this actually suggests an upside target of 7400 using “classic” technical analysis measuring methods.
Again we would warn that things may be unravelling if we start to break important support levels, in this case at 6763 and 6662.
FTSE Futures Daily Chart:
Finally I’ll say this: If today, or next week, turns out to be the top I’ll be not only very (very) surprised but also not even slightly worried that I was calling for higher prices at the market top.
I would much prefer to be the guy who was bullish all the way up in a clear rising trend as opposed to the glory hunting idiot who spent the whole move trying to be a hero by calling the top, only to keep getting stopped out!!
This article is part of the Forex Magnates Community project. If you wish to become a guest contributor, please apply here: UGC Form.