Cryptocurrencies fell for the third consecutive session on Wednesday, February 11, 2026, with Bitcoin dropping nearly 3% to test $66,000, now trading below the critical 200-week exponential moving average at $68,000 for the first time since the rally began. Ethereum declined 3.5% to $1,950, XRP fell 2% to $1.37, and Dogecoin collapsed 3% to $0.09 in its fifth straight down session.
After correctly predicting Bitcoin would drop to $74,000 in November, I'm now adjusting my scenario since the expected bounce didn't materialize, targeting $60,000-$62,000 for accumulation, with an ultimate bearish target at $52,000 (100% Fibonacci extension from September 2024).
Follow me on X for more crypto market analysis: @ChmielDk
Bitcoin Breaks Below $68K: Path to $60K Opens
Bitcoin's price fell for the third straight session, dropping nearly 3% to test $66,000 on Wednesday, a critical breakdown that puts the cryptocurrency below the 200-week exponential moving average oscillating at $68,000 on the weekly chart.
Closing below this level opens the path to revisiting the current support zone at October 2024 lows between $60,000 and $62,000. At this moment, the bearish target for Bitcoin would be the $52,000 level, the 100% Fibonacci extension based on the trend from September 2024.
- How Low Can XRP Go? 3 Downside Targets and -70% XRP Price Prediction
- Bitcoin Price Prediction: Why BTC Price Is Rallying and Forecasts for 2025-2030
- Tom Lee Cuts $250K Bitcoin Price Prediction on Thanksgiving, but Cathie Wood Stays BTC Bull
I need to be transparent about my scenario adjustment. Earlier I suggested Bitcoin would drop to $74,000, and my November forecast came true. However, I assumed then that from that level there would be a bounce and return to all-time highs. This time there was no bounce reaction, so I'm changing the scenario.
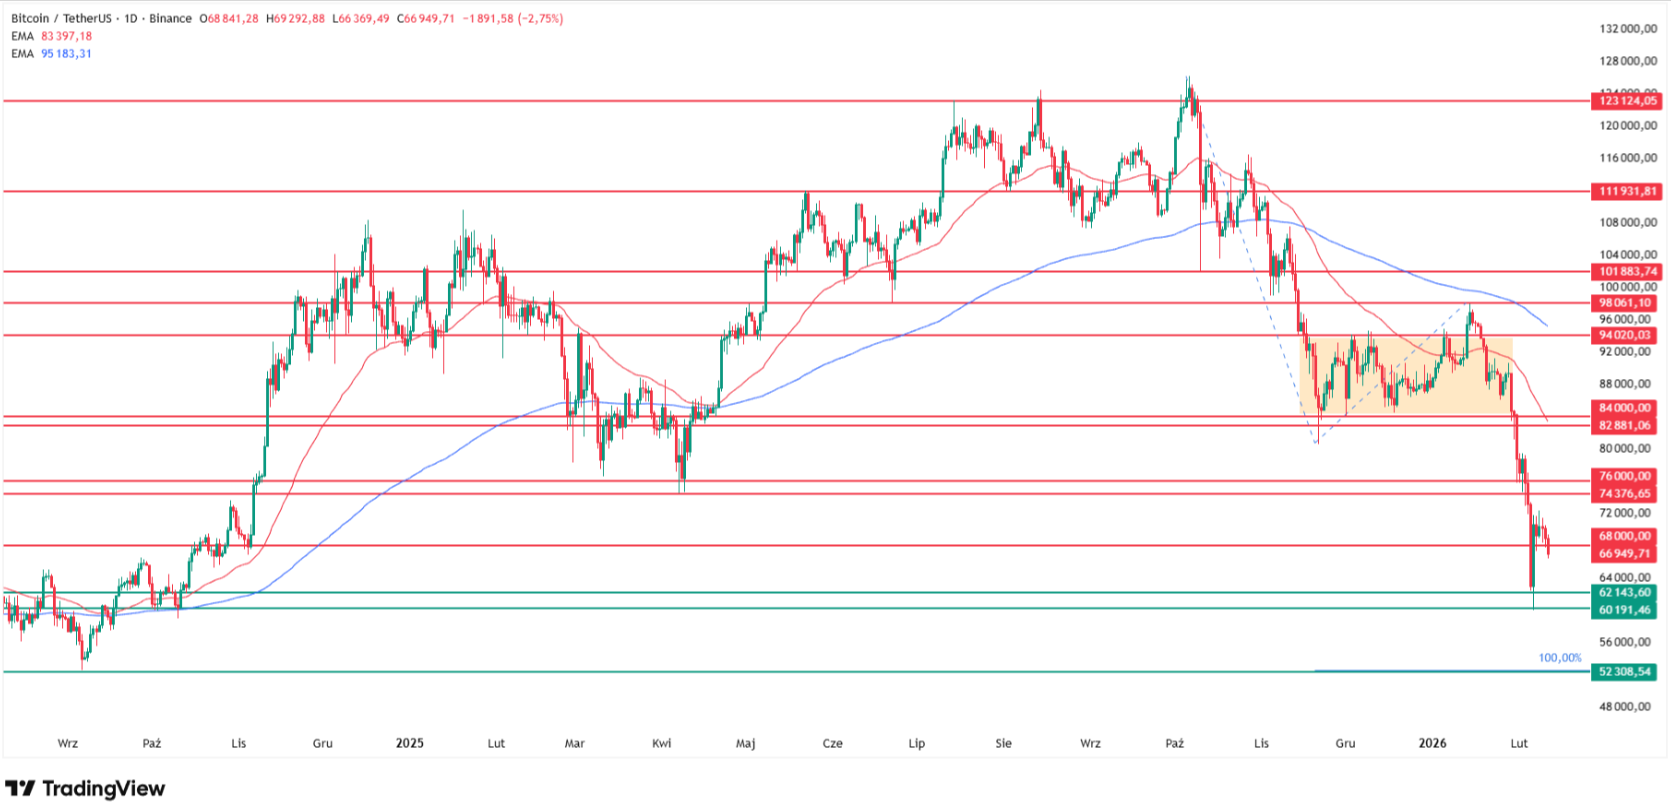
Currently I'm looking for accumulation opportunities precisely at the described target levels of $60,000-$62,000. We'll return to considering long positions if Bitcoin returns at least to $74,000, and ideally above $82,000-$84,000 where the 50 EMA currently runs.
James Harris, Group CEO at Tesseract Group, offers insight into what's happening beneath the surface: "The recent rebound looks more spot led than paper led. The two day ETF inflow streak sits alongside cautious derivatives positioning, with flat funding and reduced open interest."
Harris emphasizes that two days of inflows isn't enough to call a trend reversal. "We would want to see around five consecutive trading sessions of net ETF inflows, with funding staying near flat, before calling it a sustained regime shift." He warns that "renewed multi day ETF outflows, or a break below the mid 60s while open interest rises, would point to a bear market bounce."
Ethereum Trapped at $1,950: Downside Breakout Expected
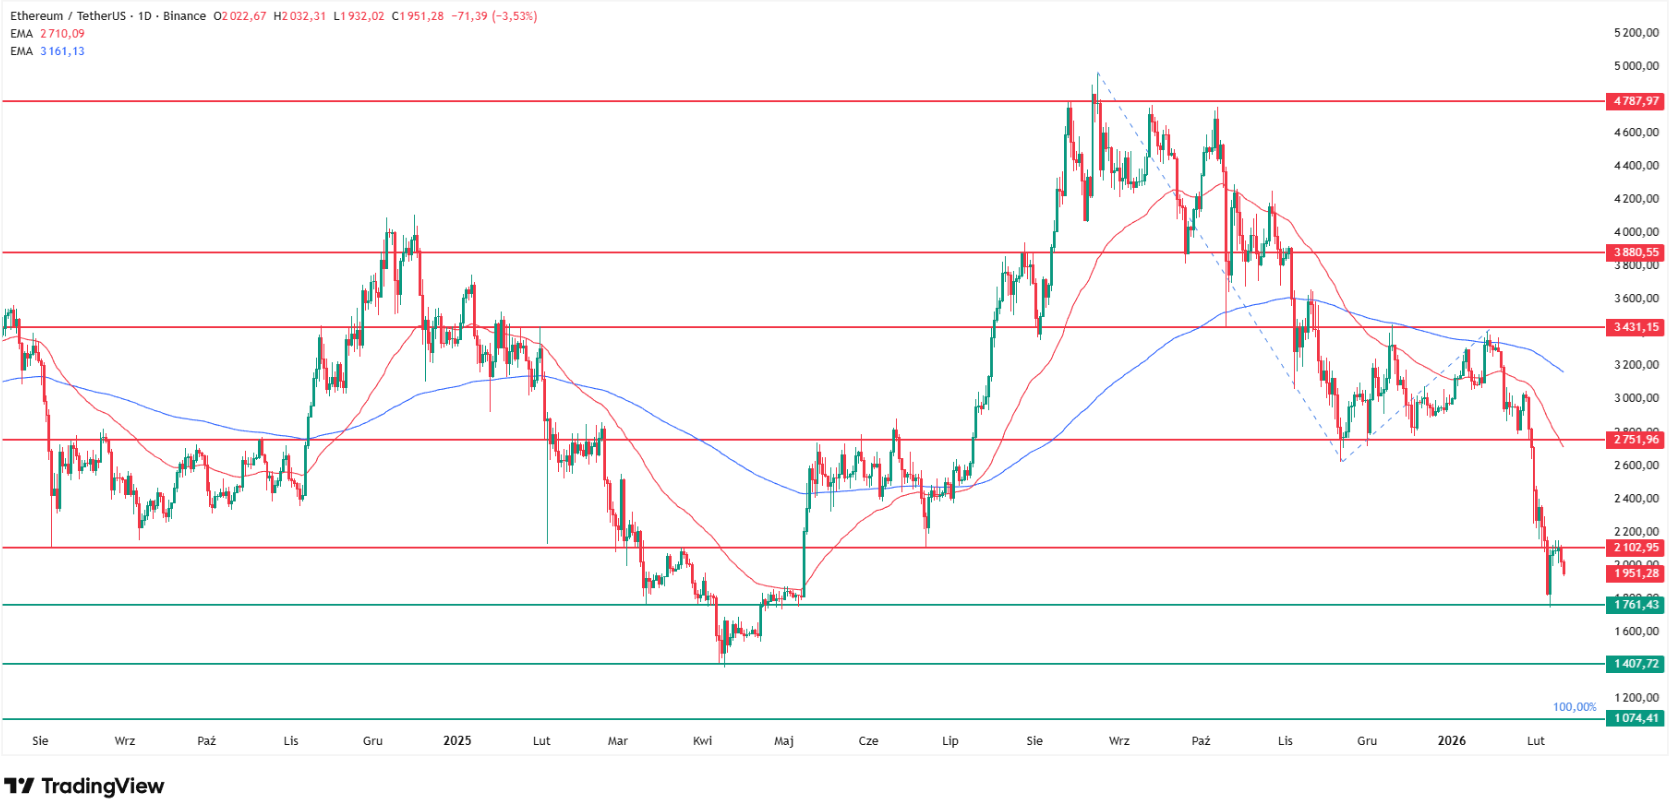
Ethereum (ETH), unlike Bitcoin, remains within the same consolidation range although it's falling clearly for the second day in a row, losing 3.5% today and trading at $1,950 per ETH.
Resistance around $2,100 designated by June 2024 lows continues to play an important role and has blocked growth attempts since last weekend. The lower boundary is this year's lows tested on February 6 around $1,800, coinciding with last year's May minimums.
What currently awaits Ethereum? The trend remains bearish when looking at the moving average setup. As a result, I would expect a downside breakout from this consolidation and a drop toward April lows at $1,400, and ultimately even the round level of $1,000, last tested in November 2022.
Jeff Anderson, Head of Asia at STS Digital, provides context on market conditions: "Given the recent blowout in options, it will take some time for the dust to settle. We expect to see decreased liquidity and nervous markets yielding larger moves in the short term."
Anderson identifies the key levels that matter: "A dip back below $70,000 is less significant as we wait for the next sustained move either below $62,000 or a break above $76,000." This aligns perfectly with my $60,000-$62,000 accumulation zone.
XRP Falls to $1.37
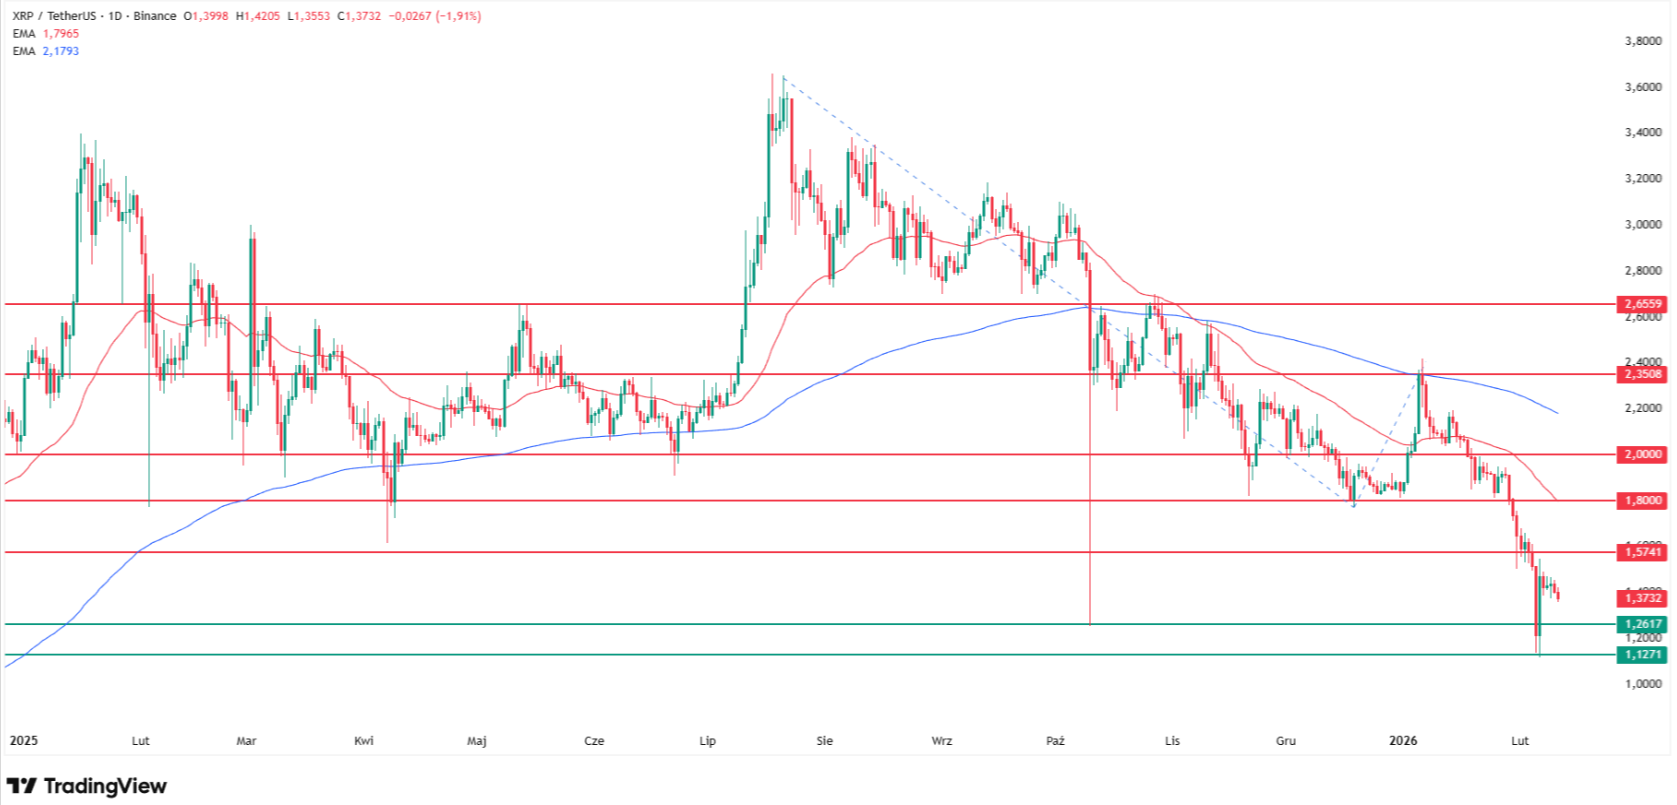
XRP notations are also falling for the second session in a row, losing 2% on Wednesday and changing hands at $1.37. From my technical analysis, the cryptocurrency is currently locked in consolidation at the lowest levels since 2024, with the upper boundary designated around $1.57.
The zone between $1.26 and $1.12 represents minimums from the October flash crash as well as lows tested last year. At this moment I would expect at least a drop to this zone, but I wouldn't rule out breaking it either if the crypto weakness continues and the main trend remains intact. In that case, I would target the round level of $1.00, where a significant number of buy orders should also be accumulated due to its psychological value.
Dogecoin Collapses to $0.09
Dogecoin (DOGE) price is falling for the fifth session in a row and reports at $0.09 on Wednesday, losing 3% compared to the previous day's close. It broke its local support level several days ago, which now constitutes resistance around $0.10. It's moving at the lowest 2024 levels.
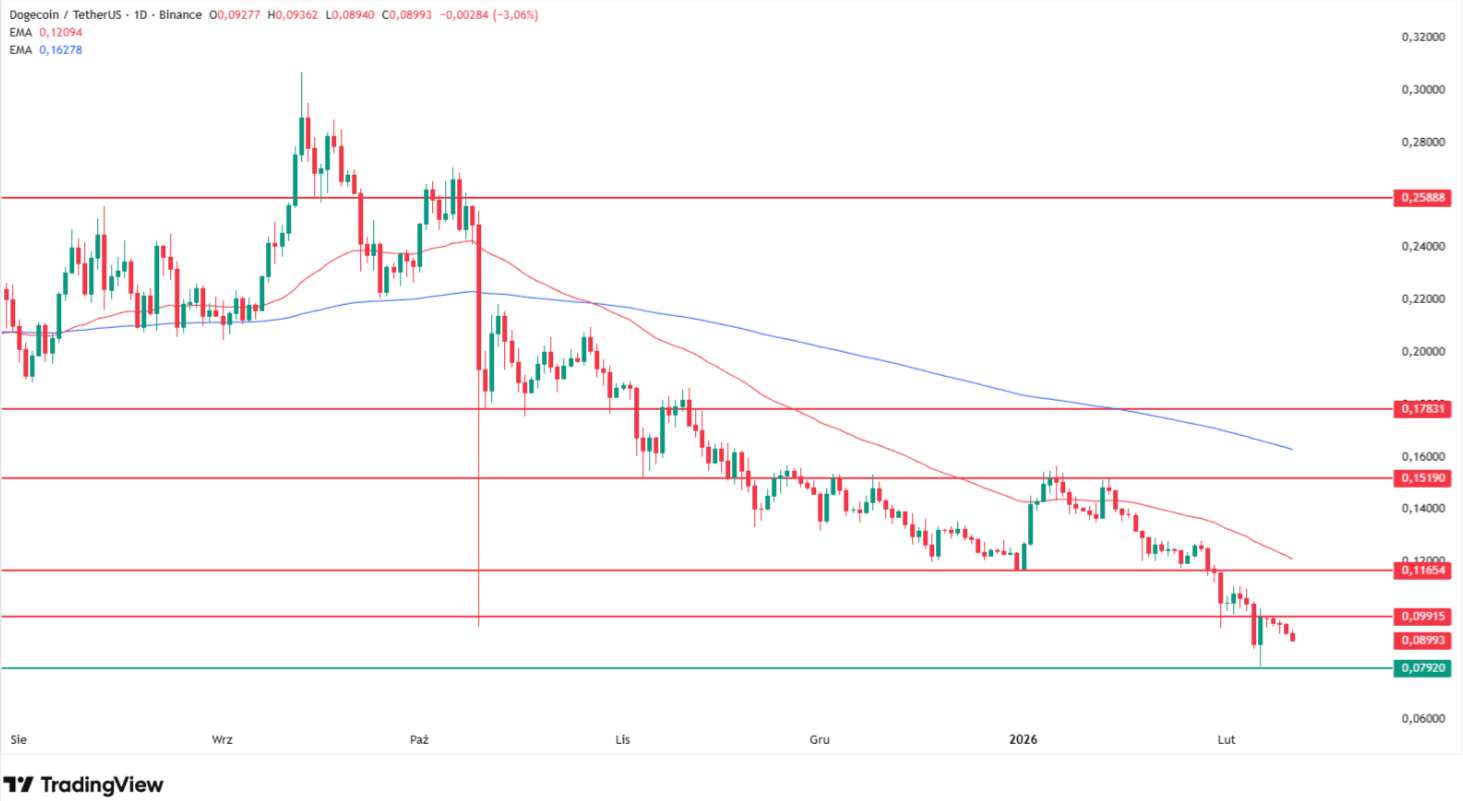
The lower boundary of this short-term setup is designated by February 6 minimums around $0.08. It's hard now to talk about any bounce possibilities unless we returned to around $0.11-$0.12—the highs from early 2026 and the 50 EMA moving average.
Why Crypto Is Going Down Today?
Paul Howard, Senior Director at Wincent, identifies a critical shift in market composition: "The decline in Open Interest (OI) demonstrates the reset we have seen in speculative interest. The focus appears to be back on spot for both institutions and ETFs."
Howard reveals remarkable activity in the spot market: "This is noted as an OTC spot desk where we are seeing the busiest month in history for spot trading as investors rather than speculators gain dominance at these lower prices."
This represents a fundamental market structure change. The speculative froth that pushed Bitcoin above $100,000 has been washed out, with leveraged traders forced to exit positions. What remains is patient capital looking to accumulate at lower levels—a healthier foundation for any future rally.
Crypto | Current Price | Change | Session | Key Support | Key Resistance | Author's Target |
Bitcoin | $66,000 | -3% | 3rd down | $60-62K | $68K (200W EMA) | $52K ultimate |
Ethereum | $1,950 | -3.5% | 2nd down | $1,800 | $2,100 | $1,400-$1,000 |
XRP | $1.37 | -2% | 2nd down | $1.26-$1.12 | $1.57 | $1.00 |
Dogecoin | $0.09 | -3% | 5th down | $0.08 | $0.10 | N/A |
James Harris notes positive on-chain signals despite the price weakness: "Exchange outflows and accumulation by larger holders support the idea of inventory moving from weak hands to stronger hands."
However, he identifies a critical caveat: "The caveat is marginal liquidity. Stablecoin balances and flows have weakened since late 2025, so the market still needs either sustained ETF demand or a stabilisation in on chain liquidity to extend the move."
FAQ, Crypto Price Analysis
Why is crypto falling today?
Crypto fell for the third consecutive session on Wednesday, February 11, 2026, with Bitcoin dropping 3% to $66,000, now below the critical 200-week EMA at $68,000. Ethereum declined 3.5% to $1,950, XRP fell 2% to $1.37, and Dogecoin collapsed 3% to $0.09 (5th down session).
How low can Bitcoin go?
Bitcoin at $66,000 is now below the 200-week EMA at $68,000, opening the path to October 2024 lows at $60,000-$62,000 where the author targets accumulation. The ultimate bearish scenario is $52,000 (100% Fibonacci extension from September 2024 trend).