The gold price in 2026 has already delivered more drama than most commodities manage in a decade. Bullion punched through $5,000 for the first time in history last month, kept climbing to $5,595 an ounce, then shed nearly $1,200 in two days in what turned out to be the metal's worst two-day rout since 1983. And yet Wall Street's biggest commodity desks mostly shrugged, and raised their gold price predictions.
A Reuters poll of 30 analysts and traders now puts the median gold price forecast for 2026 at $4,746.50 per troy ounce, the highest annual consensus in Reuters polling history going back to 2012. That same survey a year ago penciled in $2,700 for this year. The gap between those two numbers is, in itself, the story of how fast the world changed.
"We are entering a period in which the legitimacy and resilience of the institutions and systems that have underpinned global economic and geopolitical stability for decades are being tested in ways not seen in a generation," said David Russell, CEO at precious metals dealer GoldCore. It is the kind of statement that sounds hyperbolic until you look at the gold price chart.
Follow me on X for more gold market analysis: @ChmielD
One Nomination Sent the Gold Price Into a Tailspin
The catalyst for January's crash was not a data release or a central bank meeting. It was a personnel announcement. When President Donald Trump named Kevin Warsh to replace Jerome Powell as Federal Reserve chair on January 30, the gold price fell 9% in a single session - its worst one-day performance in years.
Traders initially read Warsh as a hawkish pick, someone who might resist White House pressure for looser monetary policy and keep the dollar supported. Gold closed that day at $4,894 an ounce.
- Why Gold Is Surging and Why Analyst Predicts $7,300 Price in 2026
- Why Gold Is Going Up Today? New Gold Price Prediction from Wells Fargo Targets $6,300
- Volatile Gold Makes Brokers' Risks No Longer Around P&L, but About Balance-Sheet Protection
The sell-off, in retrospect, looks more like a mass unwind of leveraged speculative positions than a fundamental reassessment. Within days, the gold price bounced back toward $5,100. By mid-February it has been consolidating in the $4,900-$5,100 range - still roughly 65% above where it was a year ago.
"Gold's thematic drivers remain positive and we believe investors' rationale for gold allocations will not have changed," analysts at Deutsche Bank wrote following the selloff.
Gold Price Predictions: What the Major Banks Are Forecasting
How high can gold go in 2026? The range of institutional gold price predictions is wide - and the upper end of those forecasts has been climbing fast.
Institution | 2026 Gold Price Forecast | Key Driver Cited |
TD Securities | $5,000 quarterly avg; $5,455-$5,700 peak | Dollar weakness, Fed pivot |
JPMorgan | $5,000 Q4 2026; $6,000 longer-term | 800 tonnes central bank buying |
Goldman Sachs | $5,400 (raised from $4,900) | De-dollarization, inflation |
Reuters Poll Median | $4,746.50 annual average | Geopolitical risk, safe haven |
Deutsche Bank | Positive; no floor change | Investor allocation rationale |
Yardeni Research | $6,000 in 2026 | Macro uncertainty |
Bart Melek, managing director and head of commodity strategy at TD Securities - one of the most closely followed voices on commodity markets - put it plainly: "Fundamentally, me and the team still like gold here." His base case of a $5,000 quarterly average comes with a technical ceiling around $5,455, and he does not rule out $5,700 given the volatility regime the market has entered.
Why Gold Will Surge?
The structural forces behind these gold price predictions are not new, but they are intensifying:
- Central bank buying reached 863 tonnes in 2025 and is expected to remain historically elevated in 2026, as reserve managers diversify away from US dollar assets
- ETF demand surged 801 tonnes in 2025 - the second-largest annual inflow on record
- De-dollarization pressures accelerated after China reportedly advised domestic banks to reduce their enthusiasm for US Treasuries, directly weakening the dollar and boosting gold
- Real rates are expected to stay low or fall further as the Fed navigates stubborn inflation alongside slowing growth - historically one of the strongest environments for gold price appreciation
- Geopolitical risk from trade wars, Venezuela, Iran, and unresolved tensions in Eastern Europe keeps the safe-haven bid alive
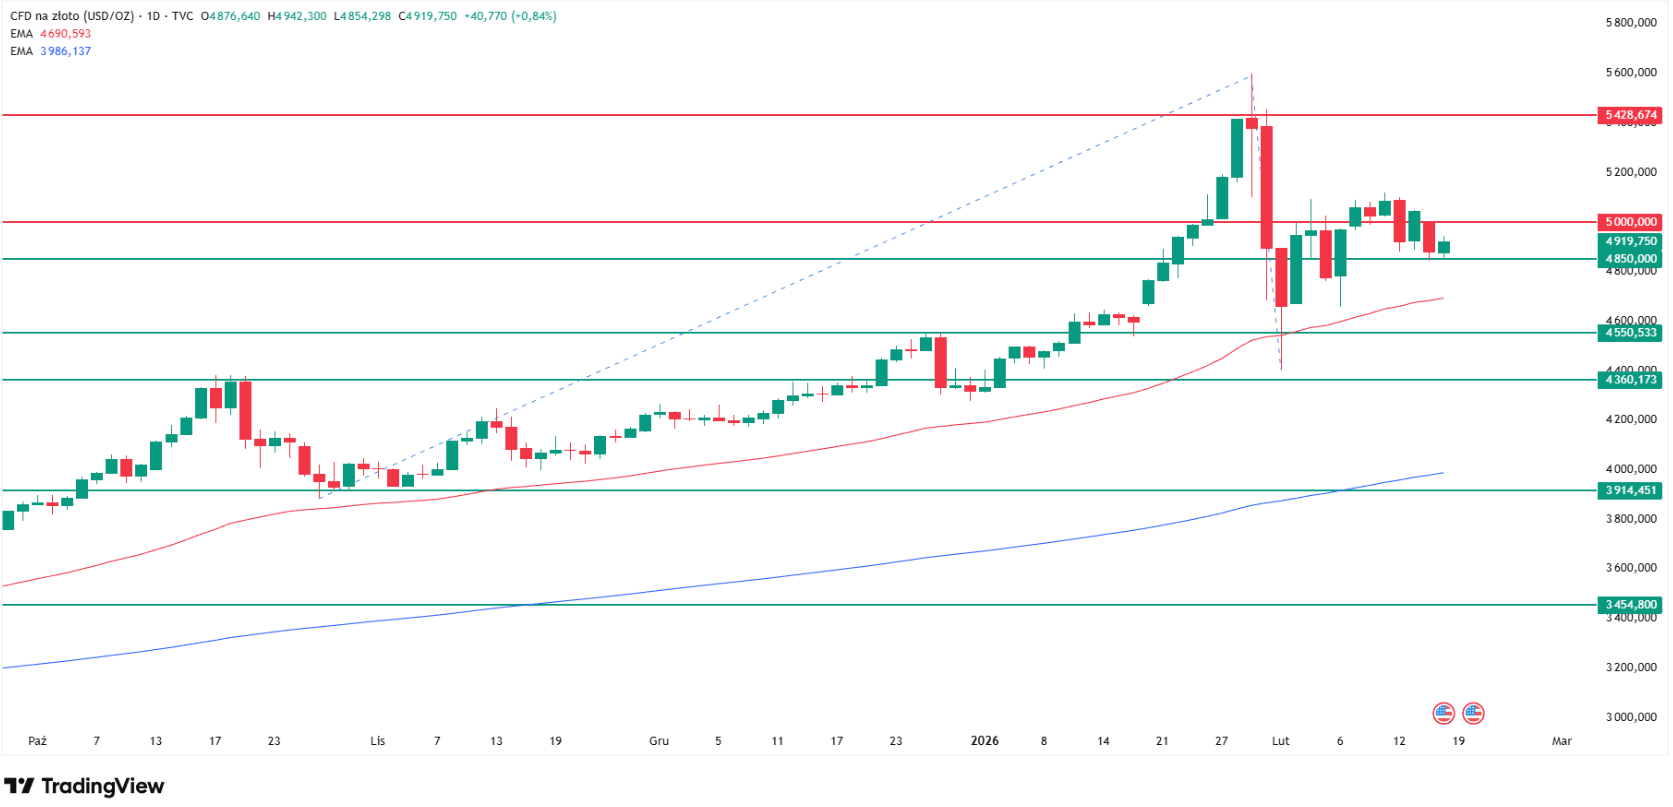
Gold Price Technical Analysis: What the Chart Is Saying
Looking at the gold price chart, the uptrend established over the past two years remains structurally intact. According to my chart reading, the roughly $1,000 correction from the January 29 high is well within the bounds of a healthy technical pullback given the pace of the preceding rally - one that took gold from around $4,300 to nearly $5,600 in a matter of weeks.
What has formed, according to my chart analysis, is a consolidation range with clearly defined boundaries:
- Lower support: $4,550 - the late-December highs that were retested as support during the January-February selloff. This level held on a closing basis and remains the primary floor of the current range
- Upper resistance: $5,420 - the January 28 closing peaks, which capped the move even as prices briefly touched $5,600 intraday on January 29
- Intermediate support: $4,850 - currently acting as a local pivot and the first line of defense in any renewed selling
- Psychological resistance: $5,000 - the level gold needs to reclaim convincingly to restore broader bullish momentum
- Local February highs: ~$5,100 - the next meaningful ceiling before a retest of all-time highs becomes credible
- 50-period EMA: ~$4,700 - the exponential moving average that would come into play on a deeper pullback
According to my technical analysis, the gold price is essentially range-bound between $4,550 and $5,420. Trading within that range is noise. What matters for the gold price prediction is which level breaks first.
To the downside, a sustained move below $4,550 would bring the more critical $4,000 zone into focus - where the 200-day moving average converges with the November 2025 lows. Based on my technical analysis, a confirmed weekly close below that cluster would be the strongest signal yet that the gold bull market, running for several years now, has finally exhausted itself. Until that happens, the trend deserves the benefit of the doubt.
Silver: The Wilder Bet
If the gold price in January was dramatic, silver's was something else entirely. The metal hit a lifetime high of $121.64 on January 29- up 147% over the course of 2025 - before crashing to $89.70 within days. The Reuters poll now forecasts a 2026 average silver price of $79.50 per ounce, up from a $50 estimate made just in October.
The mechanics of the silver spike deserve attention because they explain both the opportunity and the risk. According to Melek, the market experienced what derivatives traders call a gamma squeeze: market makers who had sold call options on silver ETFs were forced into the physical market to hedge their exposure, driving prices up in a self-reinforcing loop.
Add in two- and three-times leveraged retail products, and the move became parabolic. When CME margin requirements rose, the unwind was equally brutal.
Silver's dual identity - part safe-haven, part industrial metal - complicates the gold price prediction parallel. On one hand:
- The Silver Institute projects a sixth consecutive annual market deficit in 2026, at approximately 67 million ounces
- Physical investment demand is forecast to rise 20% to 227 million ounces - a three-year high
- Data centers, EV production, and AI infrastructure are growing end-uses
On the other hand, solar panel manufacturers are actively reducing silver content per unit to cut costs, and jewellery demand continues to weaken in key Asian markets as high prices squeeze affordability.
Silver Demand Driver | 2026 Trend | Direction |
Physical investment | +20% to 227 Moz | Up |
Industrial fabrication | -2% to ~650 Moz | Down |
Solar PV (thrifting) | Declining per-unit use | Down |
Data centers / AI | Growing end-use | Up |
Jewellery (Asia) | Weakening at high prices | Down |
LBMA inventories | Tightening but easing | Neutral |
Frequently Asked Questions About Gold Price
What is the gold price today?
As of mid-February 2026, the gold price is trading around $5,072 per ounce, having recovered from a sharp correction after hitting an all-time high of $5,595 on January 29, 2026. The price remains highly volatile - swings of $100-200 in a single session have become routine in the current market environment.
What is the gold price prediction for 2026?
The median gold price forecast for 2026, based on a Reuters poll of 30 analysts and traders, is $4,746.50 per troy ounce - the highest annual consensus in Reuters polling history dating back to 2012. Individual bank targets vary widely: JPMorgan sees $5,055 by Q4 2026, Goldman Sachs targets $5,400, TD Securities expects a quarterly average around $5,000, and Yardeni Research has set a target of $6,000.
How high can gold go in 2026?
Most institutional analysts believe gold can reach $5,000-$5,400 during 2026 under base case scenarios, with JPMorgan flagging $6,000 as a longer-term possibility. On the more aggressive end, GoldSilver.com's data-driven analysis outlines a case for prices between $8,700 and $9,000 before year-end, though this represents a fringe scenario. The key variables are central bank demand, Federal Reserve rate policy, and the trajectory of the US dollar.
Will gold go up or down in 2026?
The consensus leans up, but with significant volatility along the way. The World Gold Council outlines four scenarios for 2026: in three of them gold rises or holds steady; only in one - where the Trump administration successfully boosts US growth, reduces geopolitical risk, and triggers Fed rate hikes - does gold decline. Most analysts, including those at Deutsche Bank, JPMorgan, and TD Securities, believe the structural drivers of the gold bull market remain firmly in place.
Is gold a good investment in 2026?
Gold has outperformed most major asset classes over the past two years, returning approximately 65% in 2025 alone. Whether it remains a good investment depends on your time horizon and risk tolerance. Analysts broadly expect continued upside driven by central bank buying, dollar weakness, and geopolitical uncertainty - but also warn that volatility at record price levels is significant.
Will silver outperform gold in 2026?
Yes. Silver has already dramatically outperformed gold over the past 12 months, rising 147% in 2025 versus gold's approximately 65% gain. Whether it continues to do so depends heavily on industrial demand - particularly from the solar panel sector, which is actively reducing silver content per unit.