Bitcoin (BTC) traded at $71,362 on Wednesday, April 9, 2026, up approximately 4.5% from Tuesday's open as the two-week U.S.-Iran ceasefire collapsed crude oil prices and sent $427 million in crypto short positions into forced liquidation. The Bitcoin price prediction debate has shifted sharply over the past 72 hours.
Now BTC is pressing into the densest cluster of short liquidity in the $72,000-$73,500 range, with $6 billion in leveraged positions at risk of cascade liquidation. Morgan Stanley's MSBT, the first spot Bitcoin ETF from a major U.S. bank, launched on Tuesday with $34 million in day-one inflows, adding a fresh institutional demand channel at a pivotal moment. This week's catalysts include whether the ceasefire holds, ETF flow sustainability, and whether spot demand can force a breakout above the $75,000 range ceiling.
Follow me on X for real-time market analysis: @ChmielDk
Why Bitcoin Is Surging as Oil Crashes on Iran Ceasefire
"This does look like a directional setup, but it's being driven by a combination of macro factors and market structure rather than any single catalyst like the ceasefire alone," said Paul Howard, Senior Director at Wincent. "The recent weakness in crude oil strengthens the case for potential Fed easing, which in turn creates the conditions for a risk-on move in Bitcoin." Howard noted that Bitcoin volatility dropped below 46, its lowest level in two months, a condition that often precedes larger directional moves.
The macro transmission mechanism is direct. As the FinanceMagnates.com oil price analysis from April 7 documented, WTI crude had nearly doubled since January to $112.41 per barrel before the ceasefire announcement. The subsequent crash repriced inflation expectations, shifted rate cut probabilities, and released a wave of risk appetite across equities and crypto simultaneously.
- How High Can Bitcoin Go? This New BTC Price Prediction Targets $240K
- How Low Can Bitcoin Go? After Worst Quarter Since 2018, BTC Price Predictions Remain Bearish
- Why Is Bitcoin Crashing? How Low Can BTC Go and Bitcoin Price Prediction 2026
"Five weeks of conflict in the Gulf turned crypto into a geopolitical barometer," said Adam Saville Brown, Head of Commercial at Tesseract Group. "When Iran closed the Strait of Hormuz, Bitcoin dropped into the low $60s alongside everything else. When ceasefire talks surfaced on Sunday, it reclaimed $69,000 before most desks were open on Monday morning." Saville Brown pointed to the $427 million in short liquidations over the past 48 hours as evidence of how aggressively the market had positioned for continued escalation.
The key macro drivers behind this move:
- Oil crash: WTI crude collapsed from $112 per barrel after the ceasefire, repricing Fed rate cut expectations from zero to possible in the second half of 2026
- Short liquidation cascade: $427 million in crypto shorts liquidated in 48 hours, the largest flush since late February
- BTC-Nasdaq correlation: Bitcoin showed 85% correlation with the Nasdaq-100 during 2026 oil spikes, confirming it is trading as a high-beta risk asset
- Funding rates flat to negative: BTC perpetual funding is flat to slightly negative, confirming the rally is spot-driven, not leveraged speculation
Whale Accumulation and ETF Flows Signal Structural Demand
The flow data behind this rally is more constructive than any previous 2026 bounce. On April 6, spot Bitcoin ETFs recorded $471 million in net inflows, the strongest single day since late February, with BlackRock's IBIT, Fidelity's FBTC, and Ark Invest's ARKB absorbing the bulk.
On-chain data reveals a more significant shift. "For only the second week in 2026, Bitcoin wallets holding more than 10,000 BTC have seen inflows," Howard said. "This suggests whale accumulation rather than ETF-driven demand. If that trend continues, it increases the likelihood of a supply squeeze that could push Bitcoin toward the $75,000-$80,000 range." As I noted in my February analysis of the $60,000-$72,000 consolidation range, these accumulation zones are where the next major directional move begins to take shape.
Morgan Stanley's MSBT ETF, which began trading on NYSE Arca on April 8, adds structural demand at a critical moment. The fund drew $34 million in day-one inflows, traded more than 1.6 million shares, and charges 0.14%, the lowest fee in the U.S. spot Bitcoin ETF market. Bloomberg ETF analyst Eric Balchunas placed the debut in the top 1% of all ETF launches and projected $5 billion in assets under management within the first year. Morgan Stanley's 16,000 wealth management advisors overseeing $9.3 trillion in client assets now have a proprietary product to recommend.
Key flow data points:
- $471 million in net Bitcoin ETF inflows on April 6, strongest since late February
- $34 million in day-one MSBT inflows, top 1% of all ETF launches historically
- Whale wallets (10,000+ BTC) recorded inflows for only the second week in 2026
- Bitcoin ETFs collectively hold over $100 billion in cumulative assets under management
- Funding rates flat to slightly negative, confirming spot demand over leverage
Bitcoin Price Prediction: Technical Analysis
My chart shows that Bitcoin remains trapped in the same consolidation range it has occupied for the past two months, bounded by $75,000 resistance on the upside and approximately $62,000 support on the downside. At $71,362, BTC sits just above the 50 EMA, which it reclaimed on Tuesday's ceasefire rally.
The broader trend, however, remains bearish. The 50 and 200 EMAs crossed to the downside in November, generating a strong sell signal that I covered at the time. Since that death cross, Bitcoin has been in a structural downtrend, and the 200 EMA now sits at approximately $84,000, a considerable distance above the current price. Until BTC reclaims that level on a sustained basis, any rally occurs within the context of a bear market.
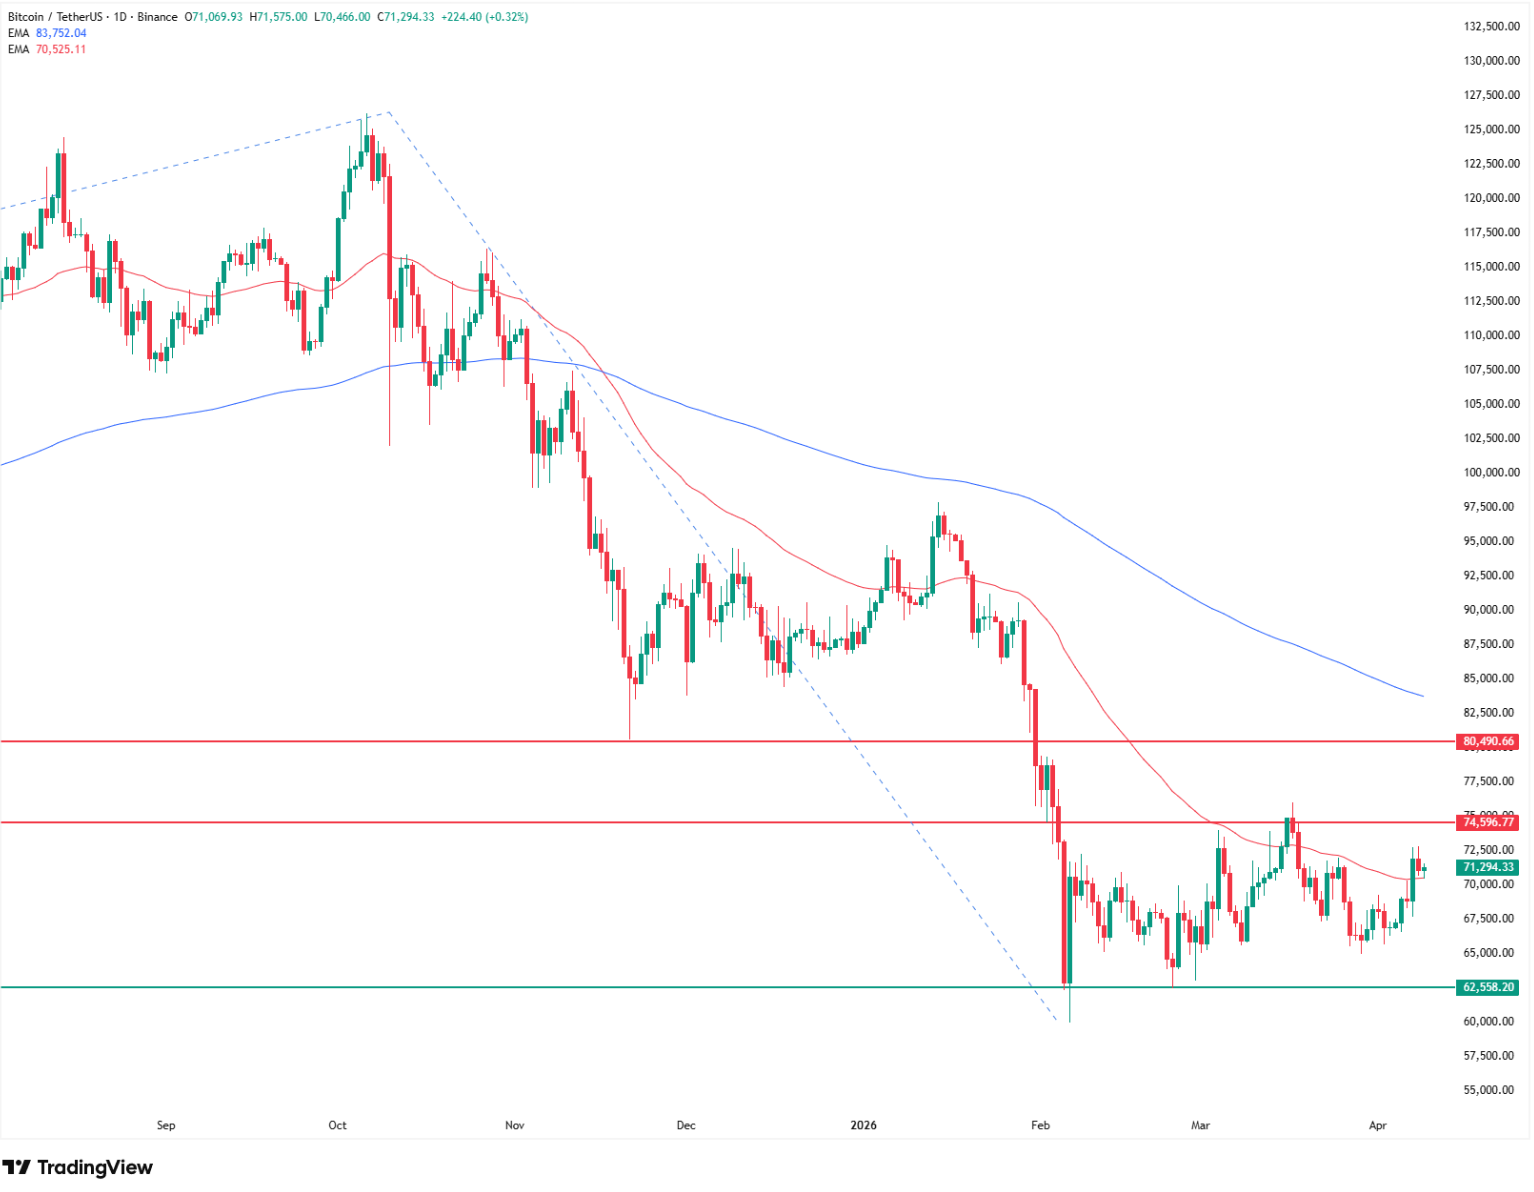
As my March analysis of BTC testing $74,500 established, the consolidation breakout above $72,000 was a genuine technical positive, but it occurred within a broader downtrend structure. The same dynamic applies now. On the resistance side, I identify the November lows just above $80,000 as an additional layer of overhead supply, meaning any push above $75,000 faces a dense resistance cluster before the 200 EMA at $84,000.
| Level | Type | Notes |
|---|---|---|
| $62,000 | Support | Two-month range floor, tested twice in February |
| $68,700 | Support / 50 EMA | Current dynamic support, reclaimed on April 8 |
| $75,000 | Resistance | Range ceiling, capped every rally since February |
| $80,000 | Resistance | November 2025 lows, overhead supply zone |
| $84,000 | 200 EMA | Bull/bear trend divider, 18% above current price |
My directional bias is cautiously bullish within the range. A daily close above $75,000 would be the first clean breakout of 2026 and could open the door to a test of the $80,000 zone. A failure to hold the 50 EMA near $68,700 on a pullback would suggest the ceasefire rally was another lower high in the downtrend, with $62,000 as the next test. As my March 24 analysis noted, BTC has gone nowhere on a net basis despite repeated multi-thousand-dollar swings.
Bitcoin Price Predictions for 2026: Bull and Bear Targets
"The ceasefire is for two weeks. That's the window," said Saville Brown. "Derivatives heatmaps show roughly $6 billion in leveraged shorts concentrated between $72,200 and $73,500, with peak density around $72,500. If spot demand can force the price through that zone, the resulting liquidation cascade would likely catapult Bitcoin through the supply gap toward $80,000."
Saville Brown is watching ETF flow data as the confirmation signal. "April 6 saw $471 million in net Bitcoin ETF inflows, the strongest day since late February. If institutional flows sustain through the week, that's a signal this isn't just short covering but a genuine reallocation." He added that Morgan Stanley's MSBT launch adds a new demand channel at a critical inflection point.
On the bearish side, the structural case remains intact. As the January FinanceMagnates.com Bitcoin price prediction noted, institutional forecasts span $75,000 to $225,000 for 2026, reflecting deep uncertainty. Canary Capital's Steve McClurg has argued that 2026 represents the "bear leg" of Bitcoin's four-year cycle, which historically produces 60-80% drawdowns from the peak. From $126,000, a 60% drawdown targets $50,400. My February bear case analysis set a primary downside target of $50,000, the August 2024 lows, which remains valid if the ceasefire collapses and oil returns above $100.
| Source | Target | Notes |
|---|---|---|
| Paul Howard, Wincent | $75,000-$80,000 | Short-term, conditional on sustained whale accumulation |
| Adam Saville Brown, Tesseract | $80,000 | Liquidation cascade through $72.5K-$73.5K short wall |
| Henrik Zeberg, Macroeconomist | $110,000-$120,000 | Primary scenario, H2 2026, ETF-driven |
| JPMorgan | $170,000-$240,000 | Long-term Fibonacci extension targets |
| Standard Chartered | $150,000 | Year-end 2026, revised down from $300,000 |
| Steve McClurg, Canary Capital | $50,400 | Four-year cycle bear leg, 60% drawdown from ATH |
As the April 2 bull case analysis detailed, JPMorgan's trend-based Fibonacci extension projects $170,000 at the 100% level and $240,000 at 161.8%, but these targets require a sustained reclaim of the 200 EMA at $84,000 and a macro regime shift.
Bull case:
- Oil stays below $95 and the ceasefire holds, reviving rate-cut expectations for H2 2026
- $6 billion in shorts between $72,200-$73,500 liquidated, creating a cascade toward $80,000
- Morgan Stanley MSBT drives sustained institutional demand through 16,000 wealth advisors
- Whale accumulation continues, tightening spot supply ahead of a macro-driven breakout
Bear case:
- Ceasefire collapses within two weeks, oil spikes back above $100, and geopolitical risk returns
- Fed remains on hold at 3.5%-3.75% with no rate cuts through 2026
- Four-year cycle drawdown targets $50,000-$50,400, consistent with 60-80% historical corrections
- BTC fails at $75,000 resistance, confirming another lower high in the structural downtrend
FAQ
What is the Bitcoin price prediction for April 2026?
Short-term Bitcoin price predictions range from $75,000-$80,000 on the bull side to a return toward $62,000-$66,000 on the bear side. The outcome depends primarily on whether the two-week U.S.-Iran ceasefire holds, keeping oil prices down and inflation expectations favorable for Fed rate cuts. Derivatives data shows $6 billion in shorts concentrated at $72,200-$73,500, making that zone the pivot between the two scenarios.
Why is Bitcoin going up today?
Bitcoin surged over 4% following the two-week U.S.-Iran ceasefire announcement, which crashed crude oil prices from $112 per barrel and triggered $427 million in crypto short liquidations within 48 hours. The oil decline shifted rate cut expectations, released risk appetite, and sent capital rotating back into crypto. Flat-to-negative funding rates confirm the rally is driven by spot demand, not leveraged speculation.
What does the Morgan Stanley Bitcoin ETF mean for BTC price?
Morgan Stanley's MSBT launched April 8, 2026 as the first spot Bitcoin ETF from a major U.S. bank, drawing $34 million in day-one inflows with the market's lowest fee at 0.14%. The bank's 16,000 advisors overseeing $9.3 trillion in client assets now have a proprietary Bitcoin product to recommend. Bloomberg analyst Eric Balchunas projects $5 billion in AUM within the first year.
Will Bitcoin reach $80,000 in 2026?
The short-term path to $80,000 requires a liquidation cascade through $6 billion in shorts between $72,200 and $73,500, followed by sustained ETF inflows and a hold of the ceasefire. Paul Howard of Wincent and Adam Saville Brown of Tesseract both identify $75,000-$80,000 as the target zone if the current setup plays out. The 200 EMA at $84,000 remains the structural barrier between bear and bull trend.
How low can Bitcoin go in 2026?
The primary bear target remains $50,000, the August 2024 lows, which aligns with Canary Capital's four-year cycle analysis projecting a 60% drawdown from the $126,000 ATH. In a range scenario, the $62,000 floor of the two-month consolidation is the first downside test. A ceasefire collapse, oil returning above $100, and continued Fed hawkishness at 3.5%-3.75% would reactivate the bearish structure.