-There is no change to recent EUR/USD comments. “The failed breakout could be bearish but EURUSD is still in a range (could end up as a triangle or flat from the 2015 low) and levels to pay attention to for support are 1.0872 (year open) and 1.0820 (May and July 2015 lows). There’s no reason to get fancy here...this is a range and upside levels to pay attention within the range for resistance are 1.1180 and 1.1250. A break above 1.1500 would argue for the flat pattern interpretation into the mid-1.20s.”
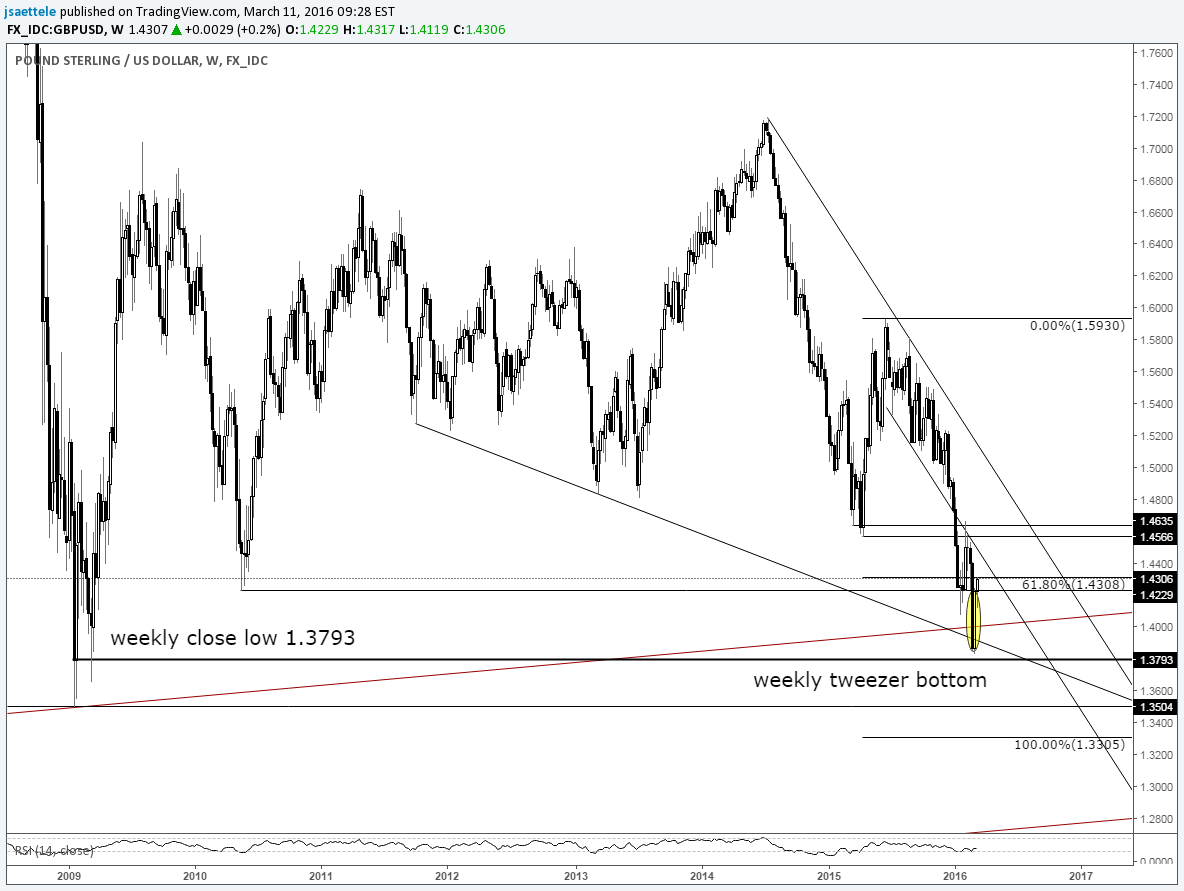
-Last week, FXTW wrote that the “close on last week’s low and the low to high move this week leave us with a ‘tweezer bottom’ candlestick formation (FXTW pointed out tweezer bottoms in AUD/USD at the September and January lows). This is a reversal pattern. The fact that the pattern formed amid the chaos of headlines (sentiment extreme on ‘Brexit’) and at a confluence of trendlines (see below) indicates increased risk for a decent sized bounce.” Cable has followed through on the reversal pattern, which is seen as a positive. General focus is higher on dips, probably until the low 1.50s.
-FXTW has maintained since the start of 2016 that “divergence with RSI on the weekly serves as a bullish reversal warning and that resistance may reside in the mid .7400s.” AUD/USD has pressed into the mid.7400s and then some. A .7600 handle was nearly printed today (3/11). Be aware of possible resistance from former support near .7600 (June 2015 low and breakdown level from last July).
-The 2nd week of April is lining up as a potentially important pivot in time. The 1993 and 2001 lows (latter is the all-time low) are exactly 392 weeks apart. 392 weeks from the 2001 low is the week of the October 2008 crash (the low was 3 weeks later). 392 weeks from the October 2008 crash is the week of April 11th. My colleague Kristian Kerr, whose cycle work is a must read, often stresses the importance of what a market is doing into a time window. In other words, a high/low could form if the market is heading into resistance/support within the window (and if other conditions are met of course). Also, a break of a key level during this time would warn of possible acceleration in the same direction. Context is key (always is). For now, just know that the week of April 11th is a big point on the X-Axis for Aussie.
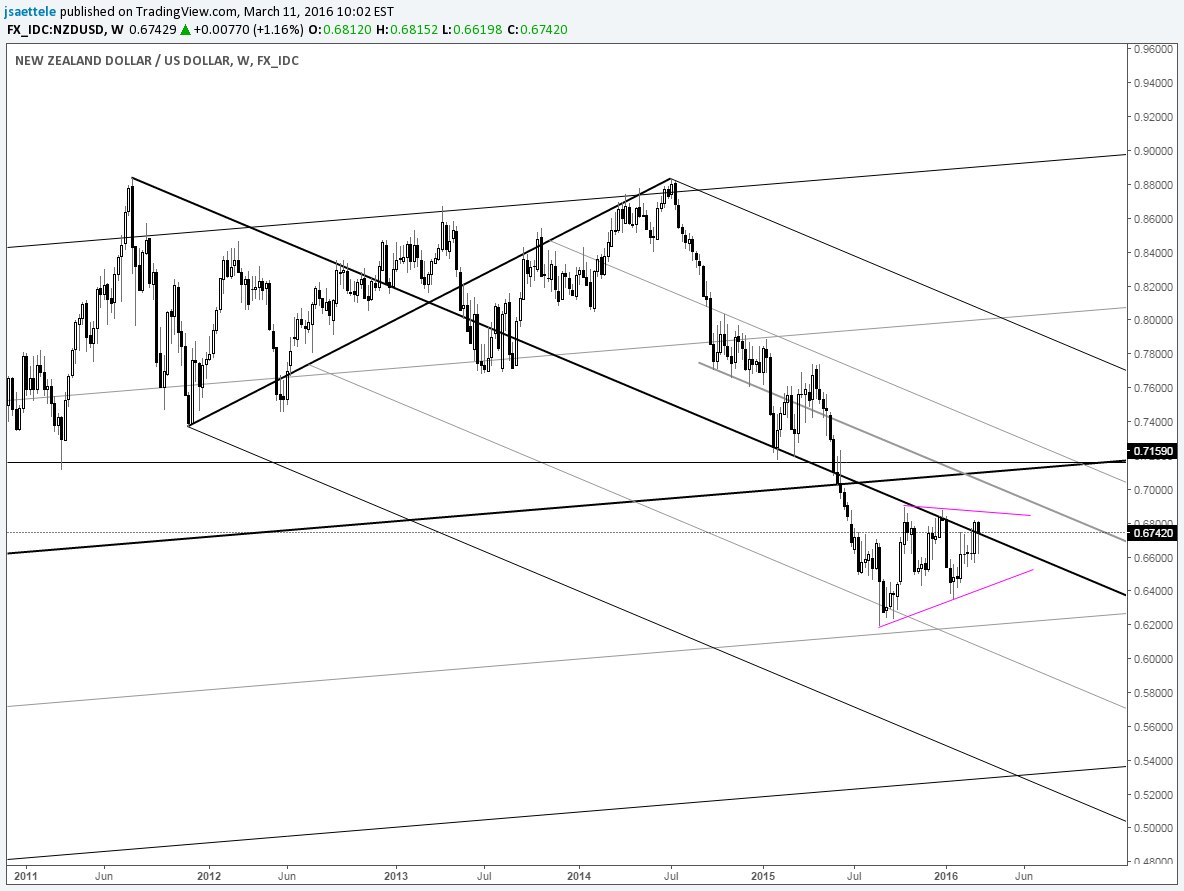
-NZD/USD has taken FXTW for a ride in recent weeks, and it’s been uncomfortable. Failures shy of the long term median line throughout February were viewed in a bearish light until last week’s outside bullish action lent near term action a more constructive look. The constructive look is maintained as long as above .6565.
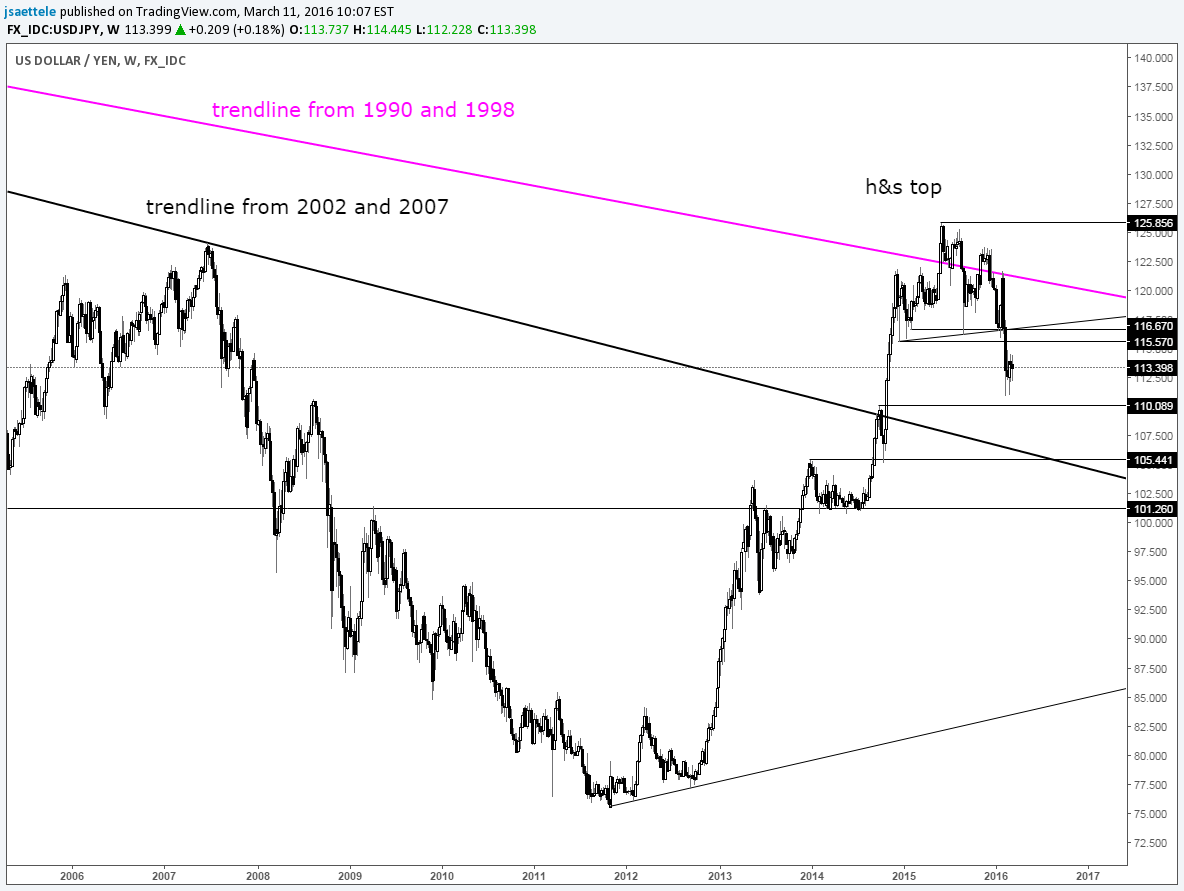
-There is no change to longer term USD/JPY comments. “USD/JPY has completed a head and shoulders pattern and the objective is mid-105.00s. There is a lot at 105, including the top side of the 2002-2007 line, the January 2014 high, and October 2014 low. Trading levels to be aware of include 110.00s (October 2014 high) and 115.50s-116.20s (breakdown level).”
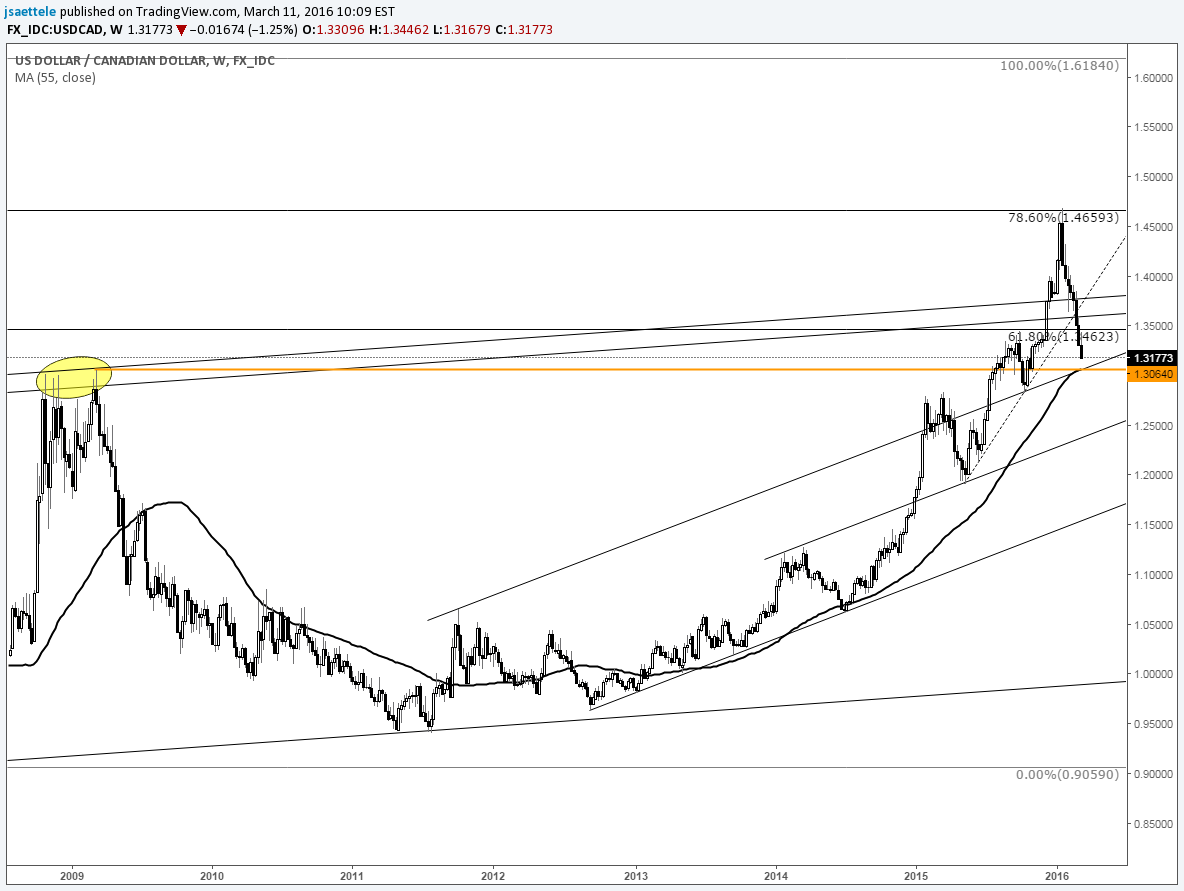
-There is no change to longer term USD/CAD comments. “USD/CAD topped at 1.4689 in January (78.6% of 2002-2007 decline) and is nearing the 61.8% measurement / October 2015 high at 1.3462. That level could provide support but any bullish operations may want to hold off until the 55 week average / internal trendline near 1.30 given the break below a 9 month trendline.”
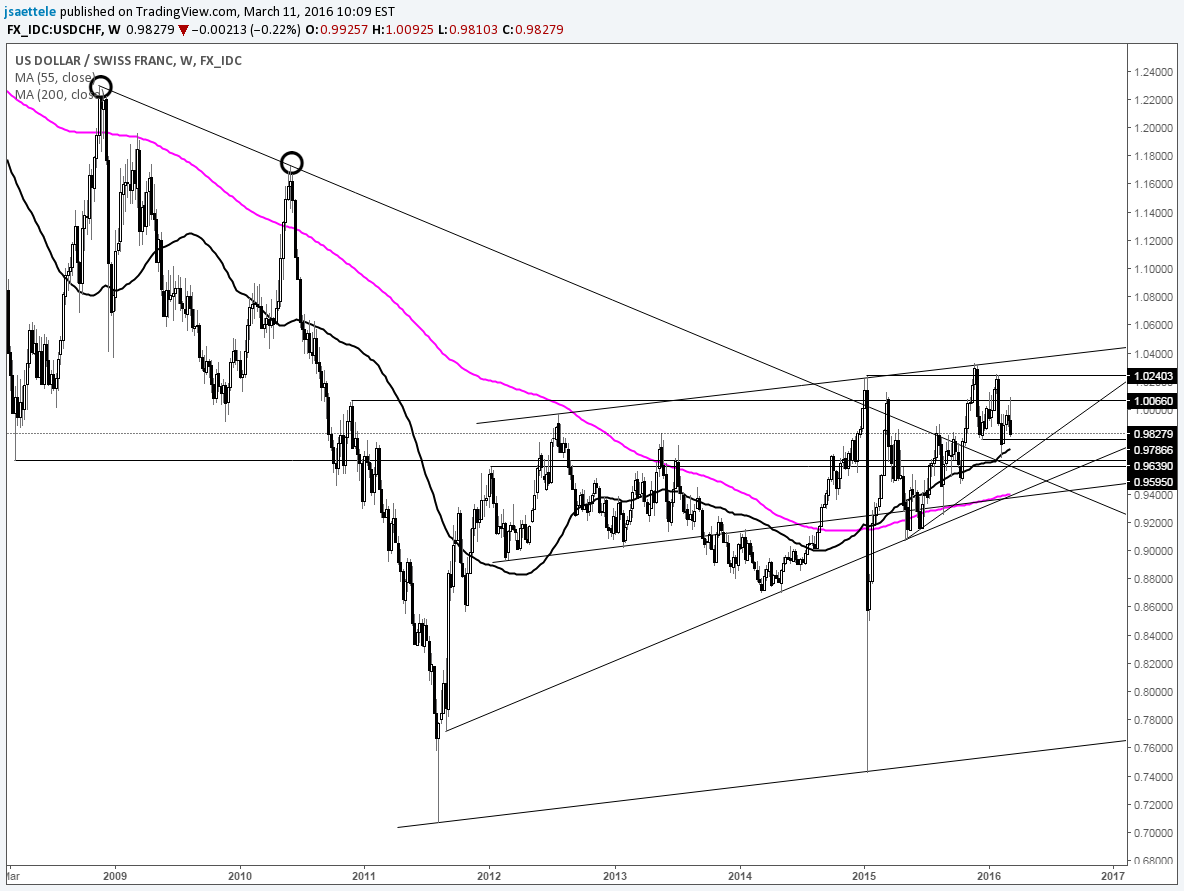
-USD/CHF is consolidating and there is nothing else to add to previous comments regarding the longer term picture at this time. “Some extremely long term technical considerations are worthy of note when looking at USD/CHF. Read about them here. Levels for possible support on this decline are .9595 (trendline and January 2012 high) and just below .9400 (trendline and 200 week average).”
Bonus Chart
Copper (COMEX) Weekly
Chart Prepared by Jamie Saettele, CMT
-FXTW wrote about copper 4 weeks ago (also see here), noting that “copper looks the most constructive that it has in years. From an FX perspective, this could be tailwind for AUD/USD.” ‘Dr. Copper’ broke out in early March. The high for the move so far is 2.3. The inverse head and shoulders pattern yields an objective of 2.3435 (4% higher than current). The level is more or less in line with a median line which was precise support in December 2014 and April 2015 and resistance in September 2015. Bottom line, 2.3435 could provide resistance in copper. Pay attention to AUD/USD when (if) copper reaches this level, especially if during the week of April 11th (read the AUD/USD piece above to understand why!).
-There is no change to recent EUR/USD comments. “The failed breakout could be bearish but EURUSD is still in a range (could end up as a triangle or flat from the 2015 low) and levels to pay attention to for support are 1.0872 (year open) and 1.0820 (May and July 2015 lows). There’s no reason to get fancy here...this is a range and upside levels to pay attention within the range for resistance are 1.1180 and 1.1250. A break above 1.1500 would argue for the flat pattern interpretation into the mid-1.20s.”
-Last week, FXTW wrote that the “close on last week’s low and the low to high move this week leave us with a ‘tweezer bottom’ candlestick formation (FXTW pointed out tweezer bottoms in AUD/USD at the September and January lows). This is a reversal pattern. The fact that the pattern formed amid the chaos of headlines (sentiment extreme on ‘Brexit’) and at a confluence of trendlines (see below) indicates increased risk for a decent sized bounce.” Cable has followed through on the reversal pattern, which is seen as a positive. General focus is higher on dips, probably until the low 1.50s.
-FXTW has maintained since the start of 2016 that “divergence with RSI on the weekly serves as a bullish reversal warning and that resistance may reside in the mid .7400s.” AUD/USD has pressed into the mid.7400s and then some. A .7600 handle was nearly printed today (3/11). Be aware of possible resistance from former support near .7600 (June 2015 low and breakdown level from last July).
-The 2nd week of April is lining up as a potentially important pivot in time. The 1993 and 2001 lows (latter is the all-time low) are exactly 392 weeks apart. 392 weeks from the 2001 low is the week of the October 2008 crash (the low was 3 weeks later). 392 weeks from the October 2008 crash is the week of April 11th. My colleague Kristian Kerr, whose cycle work is a must read, often stresses the importance of what a market is doing into a time window. In other words, a high/low could form if the market is heading into resistance/support within the window (and if other conditions are met of course). Also, a break of a key level during this time would warn of possible acceleration in the same direction. Context is key (always is). For now, just know that the week of April 11th is a big point on the X-Axis for Aussie.
-NZD/USD has taken FXTW for a ride in recent weeks, and it’s been uncomfortable. Failures shy of the long term median line throughout February were viewed in a bearish light until last week’s outside bullish action lent near term action a more constructive look. The constructive look is maintained as long as above .6565.
-There is no change to longer term USD/JPY comments. “USD/JPY has completed a head and shoulders pattern and the objective is mid-105.00s. There is a lot at 105, including the top side of the 2002-2007 line, the January 2014 high, and October 2014 low. Trading levels to be aware of include 110.00s (October 2014 high) and 115.50s-116.20s (breakdown level).”
-There is no change to longer term USD/CAD comments. “USD/CAD topped at 1.4689 in January (78.6% of 2002-2007 decline) and is nearing the 61.8% measurement / October 2015 high at 1.3462. That level could provide support but any bullish operations may want to hold off until the 55 week average / internal trendline near 1.30 given the break below a 9 month trendline.”
-USD/CHF is consolidating and there is nothing else to add to previous comments regarding the longer term picture at this time. “Some extremely long term technical considerations are worthy of note when looking at USD/CHF. Read about them here. Levels for possible support on this decline are .9595 (trendline and January 2012 high) and just below .9400 (trendline and 200 week average).”
Bonus Chart
Copper (COMEX) Weekly
Chart Prepared by Jamie Saettele, CMT
-FXTW wrote about copper 4 weeks ago (also see here), noting that “copper looks the most constructive that it has in years. From an FX perspective, this could be tailwind for AUD/USD.” ‘Dr. Copper’ broke out in early March. The high for the move so far is 2.3. The inverse head and shoulders pattern yields an objective of 2.3435 (4% higher than current). The level is more or less in line with a median line which was precise support in December 2014 and April 2015 and resistance in September 2015. Bottom line, 2.3435 could provide resistance in copper. Pay attention to AUD/USD when (if) copper reaches this level, especially if during the week of April 11th (read the AUD/USD piece above to understand why!).
Clearstream to Settle LCH-Cleared Equity Contracts
FM Daily Brief: 21 April 2026
FM Daily Brief: 21 April 2026
It's Tuesday, the twenty-first of April, twenty twenty-six. You're listening to the Finance Magnates Daily Brief. Today's lead: the Bank for International Settlements has put dollar stablecoins on the regulatory hot seat. Also ahead: first quarter earnings from Capital.com and Plus500, Revolut pushes its IPO to twenty twenty-eight, and a look at where Singapore hedge funds are really moving.
It's Tuesday, the twenty-first of April, twenty twenty-six. You're listening to the Finance Magnates Daily Brief. Today's lead: the Bank for International Settlements has put dollar stablecoins on the regulatory hot seat. Also ahead: first quarter earnings from Capital.com and Plus500, Revolut pushes its IPO to twenty twenty-eight, and a look at where Singapore hedge funds are really moving.
In this video, we review @FundedNext a proprietary trading firm offering evaluation challenges for CFD and futures traders using simulated accounts.
We cover how the model works, including challenge types, profit targets, loss limits, and performance-based rewards. You’ll also learn about payout structures, supported platforms, and key features such as the firm’s 24-hour payout policy and flexible challenge formats.
Watch the full video to see if FundedNext fits your trading approach.
#FundedNext #PropFirm #PropTrading #FinanceMagnates #Trading #CFDTrading #FuturesTrading #TradingReview
TradingPro Winner Spotlight 🏆 | Global Best Overall Broker 2025
TradingPro Winner Spotlight 🏆 | Global Best Overall Broker 2025
TradingPro takes the spotlight as Global Best Overall Broker 2025 at the Finance Magnates Awards.
Yusna Yusman, Head of Global Marketing, describes the night as inspiring, elegant, and full of energy.
She also shares a message of appreciation to the clients and community whose support made this achievement possible.
👉 Be part of FM Awards 2026.
#FinanceMagnatesAwards #TradingPro #Trading #Fintech #Broker #WinnerSpotlight #Shorts
In this video, we review @deriv an online broker offering CFDs and options across a wide range of markets, including forex, stocks, indices, commodities, cryptocurrencies, and derived indices.
We cover the broker’s overall offering, including its multi-jurisdiction regulatory structure, platform ecosystem, and range of account types. We also explore key features such as product availability, funding options, and trading conditions.
Watch the full video to see if Deriv fits your trading needs.
#Deriv #ForexBroker #CFDTrading #FinanceMagnates #Trading #BrokerReview #OnlineTrading
Opening-Up eWallets’ Future: The Enduring Value of eWallets in the Trading Space ︳FM Talks x Paysafe
Opening-Up eWallets’ Future: The Enduring Value of eWallets in the Trading Space ︳FM Talks x Paysafe
eWallets aren’t just moving money anymore, they’re running the show.
In this episode of FM Talks, Adonis Adoni (News Editor at Finance Magnates) sits down with Paysafe 's:
•Bob Legters, Chief Product Officer
•Jeannie Lam, VP of Sales & Account Management for Forex & Financial Trading
to break down how wallets evolved from simple payment tools into core trading infrastructure.
💥 Inside the conversation:
•Why wallets now drive growth, retention, and global scale for brokers
•The hidden power behind deposit success, fraud prevention, and UX
•Stablecoins: hype, reality, and where they actually fit today
•AI in wallets: smarter flows vs rising fraud risks
•The rise of white-label wallets and full ecosystem control
•What the future looks like when wallets become your financial brain
🔗 Learn more about @PaysafeGroup : https://www.paysafe.com/en/optimize-forex-payments-for-growth-in-2026/fm/?utm_source=fm&utm_medium=podcast&utm_campaign=2026-q1-fx-demand-gen&utm_content=podcast
From fiat to crypto, payments to trading, everything is converging and wallets are right at the center of it.
#Fintech #eWallets #Trading #DigitalPayments #Stablecoins #Crypto #AIinFintech #FutureOfFinance #Paysafe #FMtalks