Late in March, I stated that I believed the Euro had made a long-term bottom at the end of a 360 week cycle and would now begin a long uptrend. Subsequently, it reacted the way markets react at major support at major cyclical turning points. It has not disappointed. The market has since amplified its overbalance, even as the USD bull market has run out of steam in virtually every currency pair.
The question is: how can we profit from this? If we trade short-term on intraday charts, major trend reversals like this are not of great importance, other than the fact that it is always better to follow the main trend. But not everyone has the luxury of ignoring long-term trends. There is an opportunity here to profit from a sustained bull market. We just need to know where, or more precisely, when, to get in.
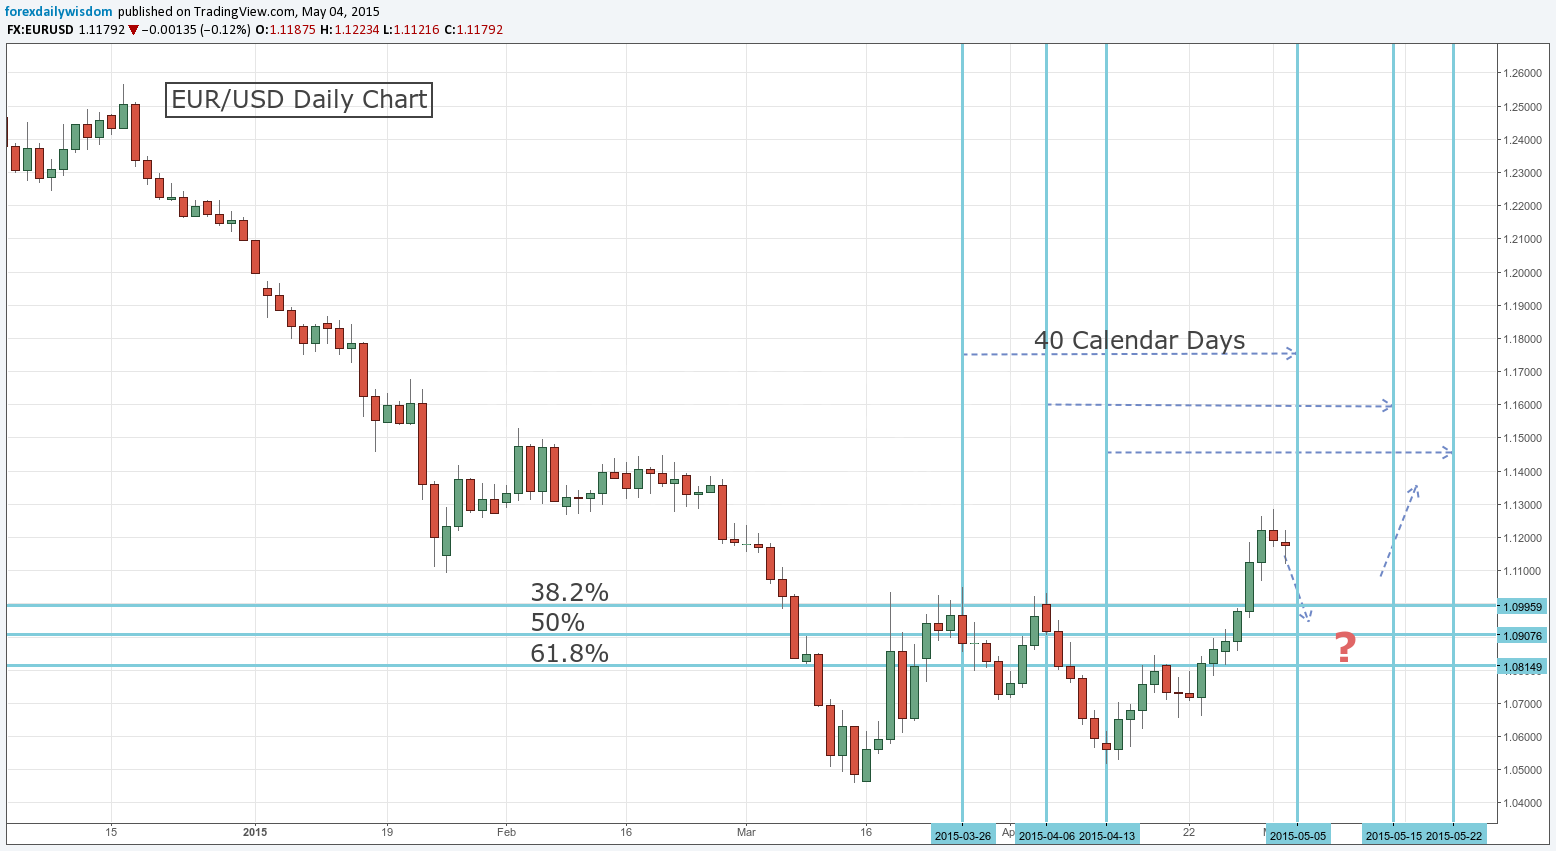
We can see in this market as in others that there is a 40 day cycle. The 16 December 2014 top forecast the 25 January bottom. The 15 October top forecast the 24 November swing bottom. The latter was short-lived as it was against a big slide, but the timing is there for all to see. Currently we have 26 March forecasting a reversal around 5 May. That date is a little too early for a bottom in my view, but I will keep an eye on it. Following that date we have 6 April forecasting16 May and 13 April forecasting 23 May. Let's keep an eye on those dates. They are both Saturdays so we will anticipate a reversal on the adjacent Monday or Friday.
What about price? Well the 50% and 61.8% retracements never disappoint. If we calculate these retracements from the secondary bottom on 13 April to the swing top on 1 May, we have a low of 1.0519 and a high of 1.1288. Anticipated resistance falls on 1.0904 and 1.0813. I would not normally pay much attention to a 38.2% retracement on short term ranges. However, this time it falls on 1.0994 which is precisely at the small double top of 26 March and 6 April. Consequently I will keep an eye on all three of these support levels.
Is there anything else to back up these prices? If we add 45 degrees to the absolute low of 1.0461 on 13 March, we get 1.0979, just 15 pips off the 38.2% retracement level. If we look at the last 3 corrections on the way down to the bottom (3 October, 8 December and 26 January), they average out at 381 pips. If we subtract 381 from the current swing top we get 1.0907, 3 pips off our 50% retracement target.
There is one more thing we need to look at, and that is trend velocity. Currently, EUR/USD is rising and falling at a rate of about 63 to 83 pips per trading day which corresponds to 5 and 7.5 degrees respectively. 63 seems the dominant trend velocity. From the top of 1.1288 on 1 May, at that rate of descent, we can calculate how long it should take the market to reach our target dates: 1.0994: 6 May 1.0904: 7 May 1.0813: 8 May
If the market corrects this quickly, then we will have to look for long signals on all of those dates. But it will likely tease us first. I would be suspicious of an apparent end to the correction this soon. The continuation could play out with rallies at each of these support levels before a final renewal of the uptrend. It will not be an easy trade, but the subsequent move will be worth the effort.