This guest article was written by Dr. Cleber Gomes who is an Electronic Engineer with a Ph.D. from Tokyo University of Technology and Agriculture.
As we approach the date of the Impeachment vote in Brazil, it might be interesting to take a look at how the Brazilian stock market behaves. In this article, I propose to do that from the point of view of Trend Following Algorithms. To exemplify, I will present the results acquired from my own Trend Following System, which is based on Machine Learning technologies, specifically Neural Networks.
Take the lead from today’s leaders. FM London Summit, 14-15 November, 2016. Register here!
Since the future is inherently unpredictable, it is simply not possible to foresee what is coming. From a financial standpoint, the most one can hope to achieve is to follow the trend of the market, or to estimate reversal points in that trend. Following a trend is not as simple as it might seem, especially when it comes to stocks, options and futures. Actually, according to the Efficient Market Hypothesis, any attempt to detect a trend in the markets is doomed to failure since prices instantly reflect all available information, never deviating from their fair values. In the real world, however, financial markets behave more as a proxy of life itself, a dynamic complex system dominated by emotional beings under the influence of both short and long term memories.
The human agents who operate in the market present a tendency to base their decisions on emotional factors, like fear and euphoria, which can’t be described in a linear fashion. For instance, the operators holding a certain stock that has suffered a great fall yesterday will probably try selling it today, motivated by the expectation or fear that the fall will continue. Some will wait longer than others to sell, and some will do so only if the price falls beyond a certain level, or stop, attaching a high degree of non-linearity to the process. This collective propensity for selling will, in its turn, accelerate the falling of prices in a positive feedback process. This kind of feedback process is responsible for the so-called herd effect.
Order out of chaos
If the stock market behaves as a dynamical complex system, there is an intrinsic order behind the appearing randomness of prices. Such order is due to the non-instantaneous way people react to new information, not taking decisions until new tendencies emerge, and then collaborating to strengthen such tendencies. Being that the case, prices are not a chance walk, but present a memory period during which past events keep influencing future events.
Actually, there is a statistical parameter, known as Hurst Exponent (H), which can be used to measure the presence of a bias, or memory effect, in temporal series that behave seemingly as chance walks. The Hurst Exponent was created by Harold Hurst, a hydrologist who, while studying Nile’s flow patterns, discovered that several natural systems follow the pattern of a biased chance walk, or a tendency with superposed noise. H, then, would be useful to measure the relationship between the strength of tendency and the noise level in the behavior of such systems.
The value of H belongs in the interval between 0 and 1, and can be understood as the probability that an increase or decrease in the level of a signal today will repeat itself in the future. When H is equal to 0.5 , there is a 50% probability of repetition, or the signal is random. I have measured H for various stocks and have rarely encountered 0.5 .
Putting theory into practice
So, having determined that there are trends to be followed in real markets, how do we detect those trends? More than answering that it is necessary to determine what is the right question to be answered. In other words, markets conditions are always changing, in a way that sometimes it seems that once we have found the answer Ms. Market changes the question! Artificial Neural Networks are quite good at modeling systems in which there are lots of variations around some basic questions, like for instance, understanding handwriting. They are modeled after Biological Neural Nets, which lie behind the amazing capability of living organisms to adapt to an ever changing world.
I have based my Trend Following Systems on Neural Nets, with some twists to achieve faster learning rates, among others. When applied to better behaved parameters like for instance the standard deviation, which is a widely used measure of Volatility , the results are surprisingly good. The figures below, which I generated for BMF&Bovespa, show that:
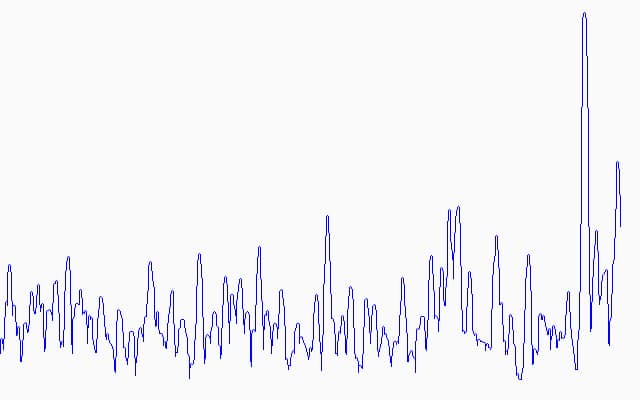
FIG 1: STANDARD DEVIATION of BOVESPA::BVMF3
FROM Jan-07-10 UNTIL Aug-05-16
LAST VALUE: 2.424
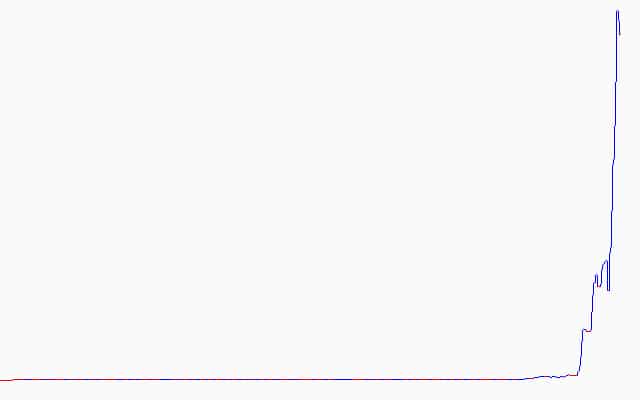
FIG 2: STANDARD DEVIATION of BOVESPA::BVMF3
FROM Jan-07-10 UNTIL Aug-05-16
LAST RETURN: 3.127292905e+012%
LAST PROFITABILITY: 65.88235295% WINNING TRADES
LAST AVERAGE GAIN/LOSS OF TRADES: 8.18373494
LAST SITUATION = RED
The last situation red in Fig. 2, in this case, means there is a greater probability that the volatility of the stock will decrease in the near future. The last return is the simulated return that would be achieved if the standard deviation could be directly traded.
Unfortunately, even though I am still working on it, there is no straightforward way to apply those results directly to trade the underlying security. However, I am still able to use the same technology to trade the underlying security itself, with results that though not as stratospheric, are still pretty good, as shown in Figs. 3 and 4.
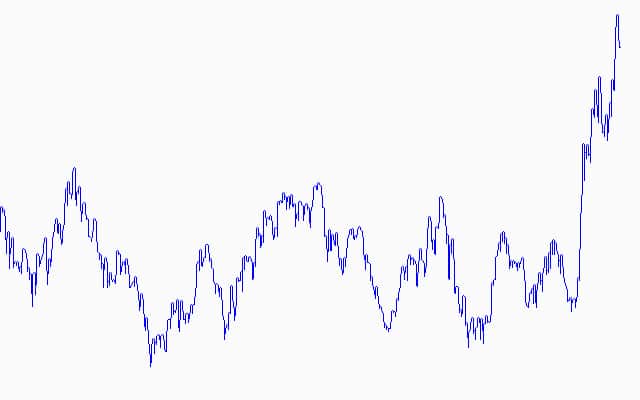
FIG. 3: BOVESPA::BVMF3
FROM Jan-05-10 UNTIL Aug-05-16
LAST PRICE: 19.12
BUY&HOLD RETURN: 49.49%

FIG. 4: BOVESPA::BVMF3
FROM Jan-05-10 UNTIL Aug-05-16
LAST RETURN: 175.021166%
LAST PROFITABILITY: 48.48484847% WINNING TRADES
LAST AVERAGE GAIN/LOSS OF TRADES: 2.542372881
LAST SITUATION = RED
Conclusion
For each asset analyzed, the last situation means the most probable mathematical trend, which by no means offers any guarantees regarding future price movements. As of Friday, August 5th, among the stocks and ETFs in the Brazilian Market that I currently monitor, there were about 4.5 times as much situations blue than red. That is definitely good news for the bulls!