

Bitcoin (BTC), the world’s most valuable digital asset, is currently struggling around the price level of $33,000 amid negative market sentiment. BTC has lost nearly 5% of its value since 7 July 2021.
According to the latest data published by Coinmarketcap, the overall market cap of digital currencies dropped by approximately $50 billion in the last 24 hours led by a correction in Bitcoin, Ethereum, Cardano, and Binance Coin. Ethereum remained the worst performer among the top 5 digital currencies with a drop of more than 5%.
Bitcoin’s total market cap dipped below $620 billion on 13 July 2021. The world’s largest cryptocurrency now has a market dominance of 45.6%. The price of BTC has remained below $40,000 since 16 June. The digital asset is currently trading near $32,500.
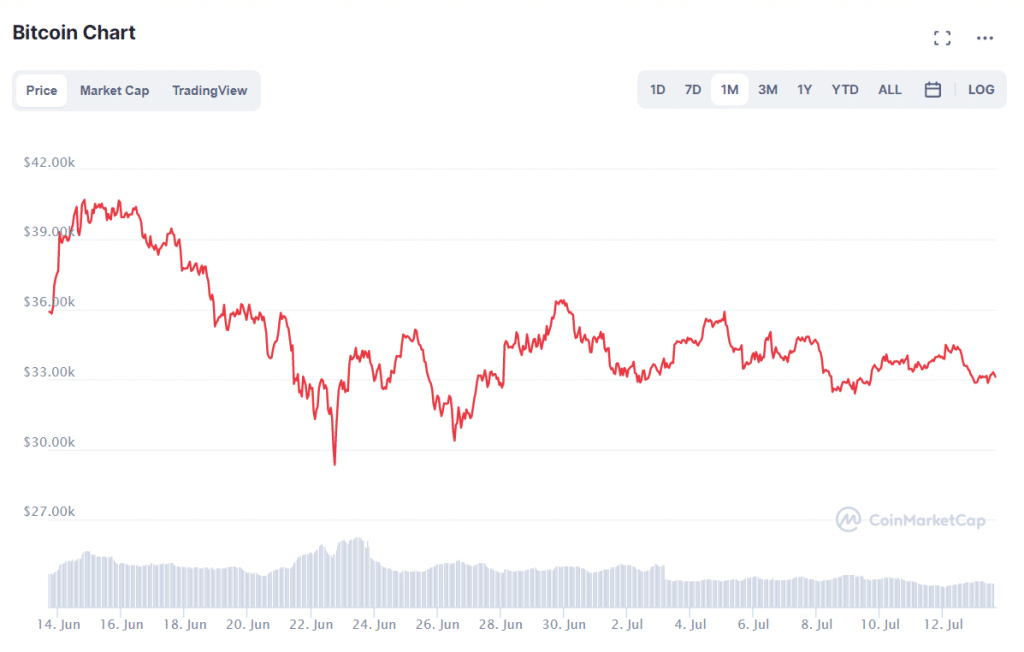
BTC Chart (coinmarketcap)
“Bitcoin’s average return for 6-month investors is sitting at a very low -27.81%. When traders are this underwater, FUD typically arises in the form of negative-driven posts,” crypto Analytics platform Santiment mentioned on Twitter.
Quiet Week for Bitcoin
Last week remained very quiet for Bitcoin as the Volatility of BTC decreased significantly. BTC’s on-chain activity also dropped sharply in the last few days. “It has been an impressively quiet week in the Bitcoin market as volatility continues to seep out, and prices squeeze into a tight consolidation range. The week opened at a high of $35,128 and traded down to a low of $32,227. It is starting to feel like the calm before the storm as muted and quiet activity appears across both spot, derivative and on-chain metrics,” on-chain analysis firm Glassnode mentioned in its latest weekly report.
Last week, Meitu, one of the leading technology firms in Asia, revealed that the fair value of the company’s Bitcoin holdings decreased by more than $17 million due to the latest correction in the price of BTC. The company purchased nearly $100 million worth of Bitcoin and Ethereum (ETH) in March 2021.


