

This guest blog post is written by Clive Lambert.
ABOUT THE AUTHOR: Clive Lambert, MSTA MCSI is chief technical analyst at FuturesTechs, a UK-based independent technical analysis company covering Equities , bonds, commodities and Forex . FuturesTechs was established in 2000 and was awarded Independent Research House of the Year at the 2014 Technical Analyst Awards. He is a former LIFFE Floor broker and the author of “Candlestick Charts.” You can connect with him on LinkedIn or Twitter.
RSI stands for Relative Strength Index and is a momentum study developed by a chap called J. Welles Wilder back in the 1970s. It has stood the test of time and is still a widely used study in technical analysis. But many people don’t use it correctly, and in times when markets are trending strongly they use it as an excuse to bat against the trend, encouraging counter-trend trading. This results in being stopped-out if the strong trend continues.
At the moment we are seeing very strong moves in a good few markets, not least the USD and the euro. So let’s use EURUSD as our “case study” to talk about the dangers of using this sort of study incorrectly.
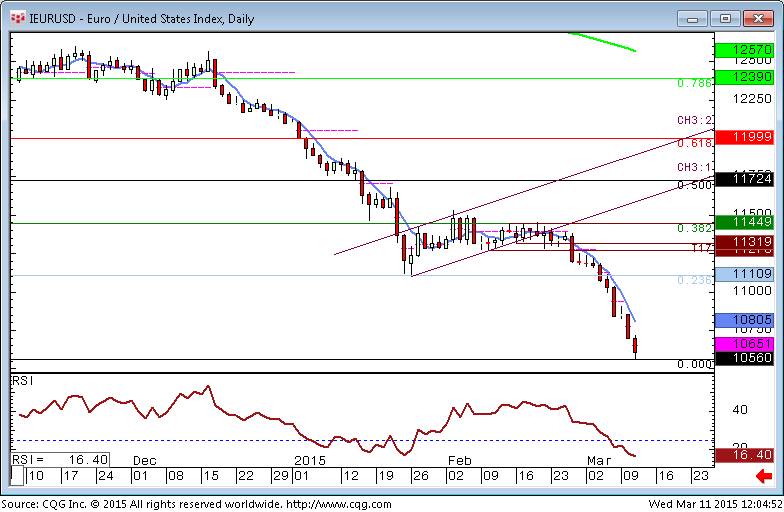
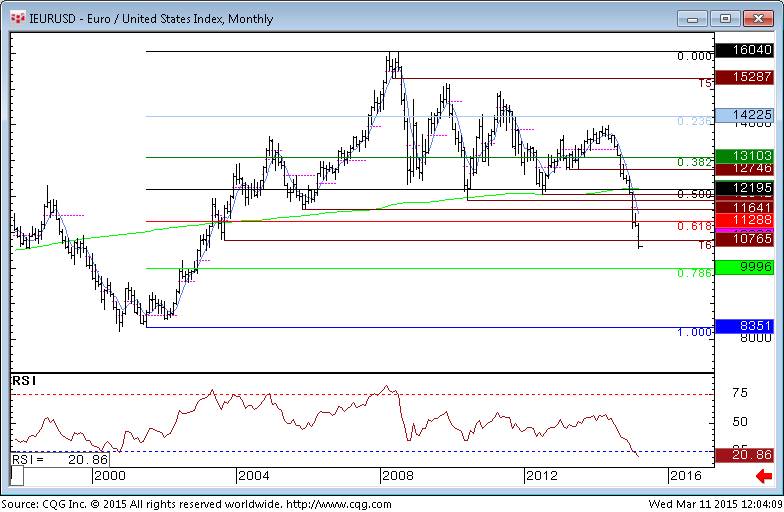
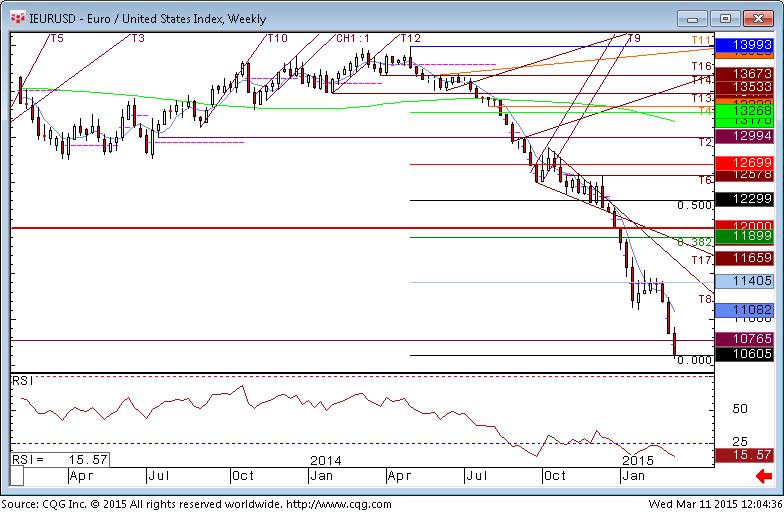
RSI oscillates between 0 and 100. A reading of 0 is the most bearish, and 100 the most bullish. It is, in basic terms, a ratio of up-days to down-days over a set period, generally defaulting to 10 or 14 (my favourite is 14 days). It very rarely gets to either of these extremes, in fact it very rarely gets above 80 or below 20. But when it does the market is deemed to be “overstretched.” So an RSI reading over 80 says the market is overbought. At the moment the RSI readings for EURUSD are 16 on the daily chart, 15.5 on a weekly timeframe and 21 on the monthly, suggesting that across all these different timeframes this current bout of selling is oversold (getting to the “silly season” stage).
Source : CQG Inc
And this is where people go wrong. They think (having not read the original textbooks by Welles Wilder and his peers) that this means “surely this can’t go on, therefore it must be time to buy.” Dangerous assumption, that.
Source: CQG Inc.
Trends persist, and trying to bat against strong persistent trends will result in losing trades. Instead one needs to look at the candlestick chart for clues as to whether buyers are being found/attracted by the lower prices. There has been very little evidence of buyers of late in EURUSD, whatever timeframe you look at. It is going down in a straight line. One of my all-time favourite phrases is, “Don’t try to catch a falling knife,” and too many people use RSI being oversold as a reason to do exactly that.
Source CQG Inc.
So I say watch the candlestick charts, look for reversal patterns (I wrote a book about this subject that you might find interesting) and only act then. In fact waiting for RSI to move from below 20 to back above 20 is the “safer” signal that this indicator can offer.
I am sure this level of selling is unsustainable, but you don’t want to give away all your money trying to be the hero that buys at the bottom. That’s just not sensible trading.
As John Maynard Keynes once said, “The market can remain irrational longer than you can remain solvent.” (There is a slightly ruder version of this involving picking bottoms but I’ll let you work that out!)
Trade with the trend, and cover either when the candlesticks suggest a turning point or until it reaches targets suggested by the chart. In EURUSD the next target we have to the downside is 1.0220, and obviously 1.0000 will get some attention if and when we get there.
Interestingly, if you’ve been short EURJPY we have just hit the 128.50 target I suggested in my piece for Forex Magnates back in January: https://www.financemagnates.com/forex/brokers/things-hotting-charts-say-ahead-ecb-tomorrow/
This article is part of the Forex Magnates Community project. If you wish to become a guest contributor, please apply here: UGC Form.