“Information is the oil of the 21st century, and Analytics is the combustion engine.” - Peter Sonergaard from Gartner Research.
In this context, traders and investors currently suffer from a glut of information… Twenty years ago the three main newswires produced around 30,000 news items per day. Today, 100TB of information is uploaded onto Facebook alone each day.
Somehow, financial market participants have to find a way of overcoming this information obesity – to sift, analyse and react quickly to the subset that is market sensitive information. If they can’t, they end up on the wrong side of the market too often.
It is my opinion and that of Hugh Taggart, that News Analytics is the science the markets turn to for help. It’s the automated discovery of information from news using two technologies called Natural Language Processing and Machine Learning . By parsing a news item machines are now capable of extracting key data from unstructured text; data such as names, locations and assets. We are also able to measure the sentiment towards these targets expressed in the news story. This gives us two advantages:
- Speed; we can quickly in the blink of an eye, detect the events and entities spoken about and the sentiment towards them. This means we can pre-set our trading system to take advantage of the swiftness in which the news can be analysed.
- Volume; multiply these mentions of names or places by millions of stories and we can accurately gauge the current market opinion or trend in any asset class. Theoretically we can catch the trend before it’s fully manifested in price.
An example of the first application might be how the trader reacts to an earthquake. Let’s assume the trader is active in NZDUSD. From his experience of the Christchurch earthquake on 22 February 2011, and other examples of market reactions to earthquakes, he’ll know not to be long NZDUSD in the immediate aftermath of a quake. So he could configure his system to close any open positions immediately on reports of an earthquake in New Zealand, hence protecting him from excessive downside.
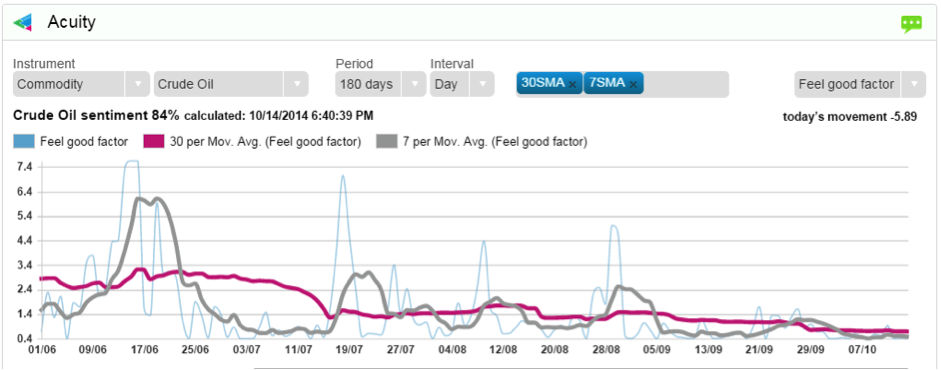
And here’s a simple example of the second use case. We have all seen crude oil’s steady decline recently. From the chart below we can see that despite a few spikes in the 7-day moving average (which coincide with peaks in the oil price), the 30-day moving average of sentiment has been trending lower since early June. Crude has been in decline since mid-June.